## Chart Type: Cumulative Distribution Function (CDF) Plots
### Overview
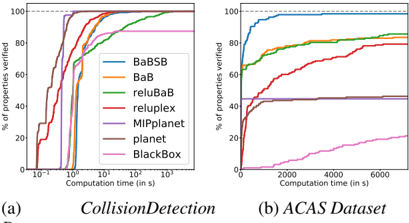
The image presents two cumulative distribution function (CDF) plots comparing the performance of different verification methods on two datasets: CollisionDetection and ACAS Dataset. The plots show the percentage of properties verified as a function of computation time. Each line represents a different verification method.
### Components/Axes
**Left Plot (CollisionDetection):**
* **X-axis:** Computation time (in s), logarithmic scale from 10^-1 to 10^3.
* **Y-axis:** % of properties verified, linear scale from 0 to 100.
* **Title:** (a) *CollisionDetection*
* **Legend (top-right):**
* BaBSB (Blue)
* BaB (Orange)
* reluBaB (Green)
* reluplex (Red)
* MIPplanet (Purple)
* planet (Brown)
* BlackBox (Pink)
* A dashed horizontal line is present at the 100% mark.
**Right Plot (ACAS Dataset):**
* **X-axis:** Computation time (in s), linear scale from 0 to 6000.
* **Y-axis:** % of properties verified, linear scale from 0 to 100.
* **Title:** (b) *ACAS Dataset*
* **Legend (same as left plot):**
* BaBSB (Blue)
* BaB (Orange)
* reluBaB (Green)
* reluplex (Red)
* MIPplanet (Purple)
* planet (Brown)
* BlackBox (Pink)
* A dashed horizontal line is present at the 100% mark.
### Detailed Analysis
**Left Plot (CollisionDetection):**
* **BaBSB (Blue):** Rises sharply, reaching 100% verified properties at approximately 1 second.
* **BaB (Orange):** Rises sharply, reaching 100% verified properties at approximately 1 second.
* **reluBaB (Green):** Rises sharply, reaching 100% verified properties at approximately 1 second.
* **reluplex (Red):** Rises sharply, reaching 100% verified properties at approximately 10 seconds.
* **MIPplanet (Purple):** Rises sharply, reaching approximately 90% verified properties at approximately 1 second.
* **planet (Brown):** Rises sharply, reaching approximately 80% verified properties at approximately 1 second.
* **BlackBox (Pink):** Rises sharply, reaching approximately 40% verified properties at approximately 1 second.
**Right Plot (ACAS Dataset):**
* **BaBSB (Blue):** Rises quickly, reaching 100% verified properties at approximately 2000 seconds.
* **BaB (Orange):** Rises quickly, reaching approximately 80% verified properties at approximately 1000 seconds, then plateaus.
* **reluBaB (Green):** Rises quickly, reaching approximately 85% verified properties at approximately 2000 seconds, then plateaus.
* **reluplex (Red):** Rises steadily, reaching approximately 70% verified properties at approximately 6000 seconds.
* **MIPplanet (Purple):** Rises slowly, reaching approximately 45% verified properties at approximately 6000 seconds.
* **planet (Brown):** Rises slowly, reaching approximately 45% verified properties at approximately 6000 seconds.
* **BlackBox (Pink):** Rises very slowly, reaching approximately 20% verified properties at approximately 6000 seconds.
### Key Observations
* On the CollisionDetection dataset, BaBSB, BaB, and reluBaB are the fastest, verifying all properties within 1 second.
* On the ACAS Dataset, BaBSB is the fastest, verifying all properties within 2000 seconds.
* BlackBox consistently performs the worst on both datasets.
* The ACAS Dataset appears to be a more challenging verification problem than the CollisionDetection dataset, as the computation times are significantly higher.
### Interpretation
The plots demonstrate the performance of different verification methods on two different datasets. The CollisionDetection dataset is relatively easy, with most methods quickly verifying all properties. The ACAS Dataset is more complex, showing a wider range of performance among the methods. BaBSB appears to be the most efficient method overall. The choice of verification method significantly impacts the computation time required to verify properties, especially for more complex datasets. The plateauing of some lines on the ACAS Dataset suggests that those methods may not be able to verify all properties within a reasonable time frame.