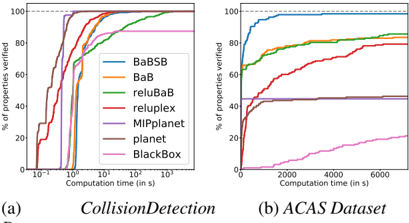
## Line Charts: Performance Comparison of Verification Methods
### Overview
The image contains two side-by-side line charts, labeled (a) and (b), comparing the performance of seven different computational methods or algorithms on two distinct datasets. The charts plot the percentage of properties verified against computation time. The overall visual suggests a performance benchmark study, likely in the field of formal verification or neural network analysis.
### Components/Axes
**Common Elements:**
* **Y-Axis (Both Charts):** Label: "% of properties verified". Scale: 0 to 100, with major ticks at 0, 20, 40, 60, 80, 100.
* **Legend (Both Charts, Top-Left Corner):** Contains seven entries with corresponding line colors:
* **BaSB** (Blue)
* **BaB** (Orange)
* **relubaB** (Green)
* **reluplex** (Red)
* **MIpplanet** (Purple)
* **planet** (Brown)
* **BlackBox** (Pink)
* **Subplot Labels:** Located below each chart: "(a)" and "(b)".
**Chart (a) Specifics:**
* **Title/Context:** "CollisionDetection" (centered below the subplot label).
* **X-Axis:** Label: "Computation time (in s)". Scale: **Logarithmic (base 10)**. Ticks are marked at 10⁰ (1), 10¹ (10), 10² (100), 10³ (1000), 10⁴ (10000).
**Chart (b) Specifics:**
* **Title/Context:** "ACAS Dataset" (centered below the subplot label).
* **X-Axis:** Label: "Computation time (in s)". Scale: **Linear**. Ticks are marked at 0, 2000, 4000, 6000.
### Detailed Analysis
**Chart (a): CollisionDetection Dataset**
* **Trend Verification:** Most lines show a steep initial rise followed by a plateau. The **BaSB (blue)** line rises the fastest, reaching near 100% verification in under 10 seconds. The **BlackBox (pink)** line shows a very slow, shallow increase, remaining below 20% even after 10,000 seconds.
* **Data Points (Approximate):**
* **BaSB (blue):** Reaches ~95% by ~5s, plateaus near 100%.
* **BaB (orange):** Follows a similar but slightly slower trajectory than BaSB, reaching ~95% by ~20s.
* **relubaB (green):** Slower than BaB, crosses 80% around 100s, approaches 100% near 1000s.
* **reluplex (red):** Rises quickly to ~70% by 10s, then increases slowly, reaching ~90% by 1000s.
* **MIpplanet (purple) & planet (brown):** Both rise to ~50% within 10s and then plateau, showing minimal improvement thereafter.
* **BlackBox (pink):** Very gradual slope, reaching only ~15% by 10,000s.
**Chart (b): ACAS Dataset**
* **Trend Verification:** The performance hierarchy is similar, but the curves are more gradual due to the linear time scale. **BaSB (blue)** again leads, but its ascent is less vertical. **BlackBox (pink)** shows a slow but steady linear increase.
* **Data Points (Approximate):**
* **BaSB (blue):** Reaches ~80% by 1000s, ~95% by 4000s, and approaches 100% by 7000s.
* **BaB (orange):** Follows BaSB closely but slightly lower, reaching ~90% by 4000s.
* **relubaB (green):** Rises to ~70% by 1000s, then increases slowly to ~80% by 7000s.
* **reluplex (red):** Increases to ~60% by 1000s, then plateaus around 65-70%.
* **MIpplanet (purple) & planet (brown):** Both plateau early, around 45-50%, showing almost no gain after the first 1000s.
* **BlackBox (pink):** Shows a near-linear increase from 0%, reaching ~20% by 7000s.
### Key Observations
1. **Consistent Leader:** The **BaSB** method (blue line) is the top performer on both datasets, verifying the highest percentage of properties in the shortest time.
2. **Consistent Laggard:** The **BlackBox** method (pink line) is the worst performer by a significant margin on both datasets, with very slow progress.
3. **Performance Clustering:** Methods cluster into distinct performance tiers:
* **Tier 1 (High):** BaSB, BaB
* **Tier 2 (Medium):** relubaB, reluplex
* **Tier 3 (Low):** MIpplanet, planet
* **Tier 4 (Very Low):** BlackBox
4. **Dataset Impact:** The **CollisionDetection** dataset (a) appears "easier" for most methods, as they reach higher verification percentages faster (note the log scale). The **ACAS Dataset** (b) seems more challenging, with slower progress and lower final plateaus for several methods (MIpplanet, planet, reluplex).
5. **Plateau Behavior:** Several methods (MIpplanet, planet, reluplex in chart b) hit a clear performance ceiling, suggesting they cannot verify a certain class of properties regardless of additional computation time.
### Interpretation
This data strongly suggests that the **BaSB** algorithm is the most efficient and effective approach for the property verification tasks represented by these two datasets. Its superior performance is consistent across different problem domains (CollisionDetection vs. ACAS).
The stark contrast between BaSB/BaB and methods like BlackBox indicates that the underlying technique (likely some form of intelligent search or abstraction, given names like "BaB" which often stands for Branch and Bound) is crucial. The "BlackBox" method, which treats the system as opaque, is fundamentally limited.
The plateauing of methods like MIpplanet and planet implies they may be getting stuck in local optima or lack the mechanisms to handle more complex verification conditions present in the datasets. The difference in curve shapes between the log-scale (a) and linear-scale (b) charts highlights that while some methods are excellent at quick, early wins (high initial slope on log scale), their long-term scalability varies.
**In summary, the charts provide compelling evidence for the adoption of BaSB-like techniques over the other compared methods for these specific verification tasks, with BlackBox being an ineffective choice.** The results also hint at the relative difficulty of the ACAS dataset compared to the CollisionDetection benchmark.