## Flowchart: Study Identification and Selection Process
### Overview
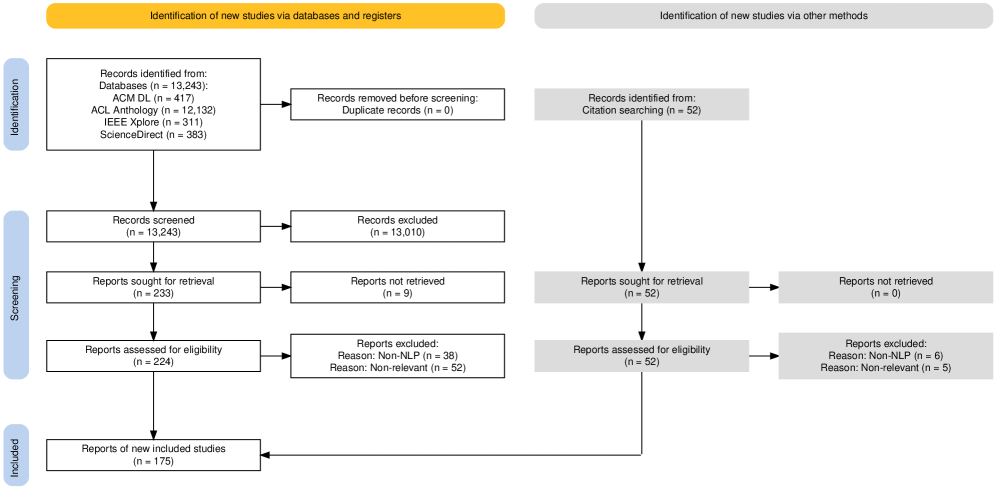
The image is a flowchart illustrating the process of identifying and selecting studies for inclusion in a review or meta-analysis. It outlines the steps involved in identifying studies from databases and registers, as well as from other methods like citation searching, and the subsequent screening and inclusion/exclusion criteria.
### Components/Axes
The flowchart is divided into two main columns:
1. **Left Column (Yellow Header):** "Identification of new studies via databases and registers"
2. **Right Column (Gray Header):** "Identification of new studies via other methods"
The flowchart also has three vertical sections, indicated by colored bars on the left:
1. **Top (Blue):** "Identification"
2. **Middle (Blue):** "Screening"
3. **Bottom (Blue):** "Included"
The flowchart uses rectangular boxes to represent stages in the process, with arrows indicating the flow of studies between stages. Each box contains a description of the stage and the number of studies at that stage (n = value).
### Detailed Analysis or ### Content Details
**Left Column (Databases and Registers):**
* **Identification:**
* "Records identified from: Databases (n = 13,243):"
* "ACM DL (n = 417)"
* "ACL Anthology (n = 12,132)"
* "IEEE Xplore (n = 311)"
* "ScienceDirect (n = 383)"
* "Records removed before screening: Duplicate records (n = 0)"
* **Screening:**
* "Records screened (n = 13,243)"
* "Records excluded (n = 13,010)"
* "Reports sought for retrieval (n = 233)"
* "Reports not retrieved (n = 9)"
* **Included:**
* "Reports assessed for eligibility (n = 224)"
* "Reports excluded: Reason: Non-NLP (n = 38), Reason: Non-relevant (n = 52)"
* "Reports of new included studies (n = 175)"
**Right Column (Other Methods):**
* **Identification:**
* "Records identified from: Citation searching (n = 52)"
* **Screening:**
* "Reports sought for retrieval (n = 52)"
* "Reports not retrieved (n = 0)"
* **Included:**
* "Reports assessed for eligibility (n = 52)"
* "Reports excluded: Reason: Non-NLP (n = 6), Reason: Non-relevant (n = 5)"
* The arrow from "Reports of new included studies (n=175)" in the left column points to the right column, but does not connect to any specific box.
### Key Observations
* The majority of records were identified through databases and registers (13,243) compared to citation searching (52).
* A large number of records were excluded during the screening process (13,010 from databases and registers).
* The primary reasons for excluding reports were "Non-NLP" and "Non-relevant".
* The final number of included studies from databases and registers is 175.
* The number of reports not retrieved is significantly different between the two methods (9 vs 0).
### Interpretation
The flowchart provides a clear overview of the study selection process. The large number of records excluded during screening highlights the importance of well-defined inclusion and exclusion criteria. The reasons for exclusion ("Non-NLP" and "Non-relevant") suggest that the search strategy may have retrieved many studies outside the scope of the review. The difference in the number of reports not retrieved between the two methods could indicate differences in accessibility or availability of studies identified through databases versus citation searching. The arrow from the left column's final box to the right column is ambiguous and may indicate a combination of studies from both methods.