\n
## Flow Diagram: PRISMA Flow Diagram
### Overview
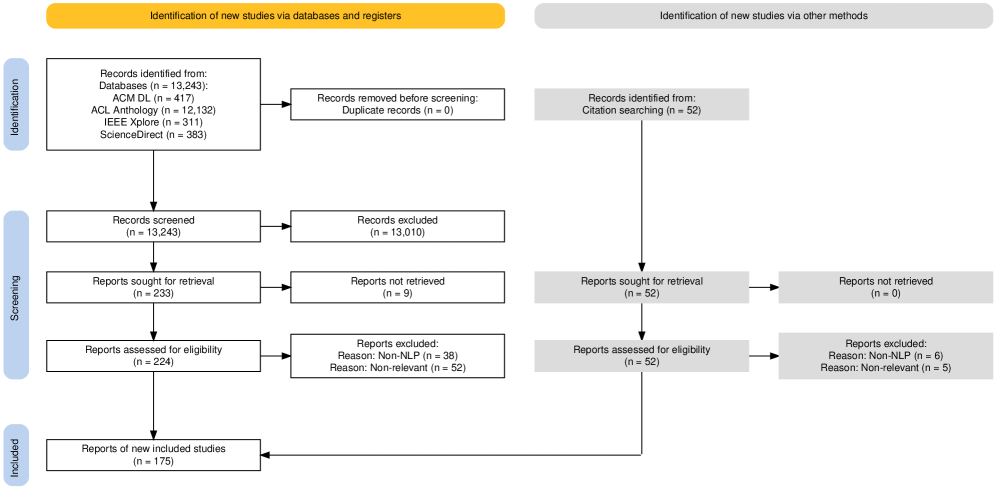
This image presents a PRISMA (Preferred Reporting Items for Systematic Reviews and Meta-Analyses) flow diagram, illustrating the flow of information through the different phases of a systematic review. It visually depicts the number of records identified, screened, assessed, and ultimately included in the study. The diagram is split into two columns representing records identified from databases and registers, and records identified from other methods.
### Components/Axes
The diagram is structured in three main sections: Identification, Screening, and Included. Each section contains boxes representing stages in the review process, connected by arrows indicating the flow of records. Each box displays the number of records at that stage (n = value). Reasons for exclusion are also provided in some boxes.
### Detailed Analysis or Content Details
**Identification:**
* **Records identified from Databases (n = 13,243):**
* ACM DL (n = 417)
* ACL Anthology (n = 12,132)
* IEEE Xplore (n = 311)
* ScienceDirect (n = 383)
* **Records removed before screening:** Duplicate records (n = 0)
* **Records identified from Citation searching (n = 52)**
**Screening:**
* **Records screened (n = 13,243)**
* **Records excluded (n = 13,010)**
* **Reports sought for retrieval (n = 233)**
* **Reports not retrieved (n = 9)**
* **Reports assessed for eligibility (n = 224)**
* **Reports excluded:**
* Reason: Non-NLP (n = 38)
* Reason: Non-relevant (n = 52)
* **Reports sought for retrieval (n = 52)**
* **Reports not retrieved (n = 0)**
* **Reports assessed for eligibility (n = 52)**
* **Reports excluded:**
* Reason: Non-NLP (n = 6)
* Reason: Non-relevant (n = 5)
**Included:**
* **Reports of new included studies (n = 175)**
### Key Observations
The vast majority of identified records (13,010) were excluded during the screening process. The primary reasons for exclusion were being non-NLP (Natural Language Processing) related and being non-relevant to the review's scope. A relatively small number of records were identified through citation searching (52) compared to database searches (13,243). The final number of included studies is 175.
### Interpretation
This PRISMA flow diagram provides a transparent and comprehensive overview of the study selection process. The large number of excluded records highlights the importance of rigorous screening criteria. The distinction between reasons for exclusion (Non-NLP and Non-relevant) suggests specific inclusion/exclusion criteria were applied. The diagram demonstrates a systematic approach to identifying and selecting relevant studies, ensuring the robustness and validity of the review's findings. The difference in the number of records identified from databases versus citation searching suggests that database searching was the primary method for identifying relevant literature. The diagram is a standard tool for reporting systematic reviews and meta-analyses, promoting transparency and reproducibility.