TECHNICAL ASSET FINGERPRINT
cf76ec502efc6e4511760d45
Click to view fullscreen
Press ESC or click to close
FOUND IN PAPERS
EXPERT: healer-alpha-free VERSION 1
RUNTIME: free/openrouter/healer-alpha
INTEL_VERIFIED
## [Multi-Panel Line Chart]: Performance of Various ML/ILP Methods vs. Training Sample Size
### Overview
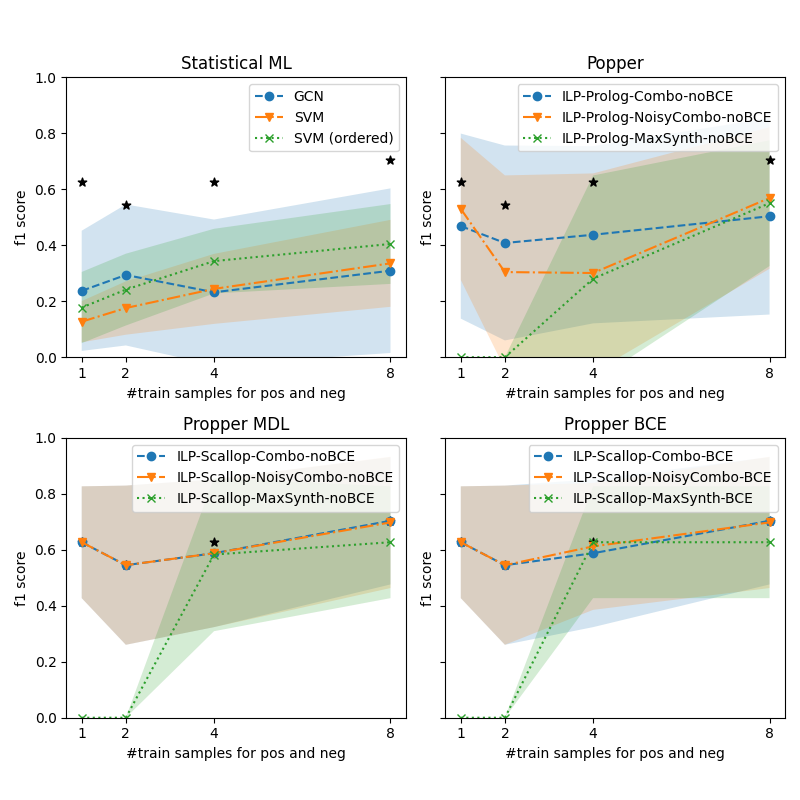
The image contains four separate line charts arranged in a 2x2 grid. Each chart plots the F1 score (y-axis) against the number of training samples for positive and negative classes (x-axis) for different machine learning or Inductive Logic Programming (ILP) methods. The charts compare the performance trends of these methods as the training set size increases from 1 to 8 samples. Shaded regions around each line likely represent confidence intervals or standard deviation. Black star markers appear at specific data points across all charts.
### Components/Axes
* **Common Elements (All Charts):**
* **X-axis:** Label: `#train samples for pos and neg`. Ticks/Values: `1`, `2`, `4`, `8`.
* **Y-axis:** Label: `f1 score`. Scale: `0.0` to `1.0` with increments of `0.2`.
* **Legend:** Positioned in the top-right corner of each subplot. Contains three data series with distinct markers and line styles.
* **Black Stars:** Five-pointed star markers (`★`) are plotted at specific (x, y) coordinates in each chart, seemingly independent of the main data series.
* **Chart-Specific Titles & Legends:**
1. **Top-Left Chart:** Title: `Statistical ML`. Legend:
* `GCN` (Blue circle marker, dashed line)
* `SVM` (Orange downward triangle marker, dashed line)
* `SVM (ordered)` (Green 'x' marker, dotted line)
2. **Top-Right Chart:** Title: `Popper`. Legend:
* `ILP-Prolog-Combo-noBCE` (Blue circle marker, dashed line)
* `ILP-Prolog-NoisyCombo-noBCE` (Orange downward triangle marker, dashed line)
* `ILP-Prolog-MaxSynth-noBCE` (Green 'x' marker, dotted line)
3. **Bottom-Left Chart:** Title: `Propper MDL`. Legend:
* `ILP-Scallop-Combo-noBCE` (Blue circle marker, dashed line)
* `ILP-Scallop-NoisyCombo-noBCE` (Orange downward triangle marker, dashed line)
* `ILP-Scallop-MaxSynth-noBCE` (Green 'x' marker, dotted line)
4. **Bottom-Right Chart:** Title: `Propper BCE`. Legend:
* `ILP-Scallop-Combo-BCE` (Blue circle marker, dashed line)
* `ILP-Scallop-NoisyCombo-BCE` (Orange downward triangle marker, dashed line)
* `ILP-Scallop-MaxSynth-BCE` (Green 'x' marker, dotted line)
### Detailed Analysis
**1. Statistical ML (Top-Left):**
* **Trend Verification:**
* **GCN (Blue):** Slopes gently upward. Starts low, increases slightly.
* **SVM (Orange):** Slopes upward. Starts lowest, shows steady improvement.
* **SVM (ordered) (Green):** Slopes upward. Starts higher than SVM, maintains a lead.
* **Data Points (Approximate F1 scores):**
* **x=1:** GCN ~0.23, SVM ~0.13, SVM (ordered) ~0.18. Black Star at ~0.62.
* **x=2:** GCN ~0.29, SVM ~0.18, SVM (ordered) ~0.24. Black Star at ~0.55.
* **x=4:** GCN ~0.23, SVM ~0.24, SVM (ordered) ~0.35. Black Star at ~0.62.
* **x=8:** GCN ~0.30, SVM ~0.34, SVM (ordered) ~0.40. Black Star at ~0.70.
**2. Popper (Top-Right):**
* **Trend Verification:**
* **ILP-Prolog-Combo-noBCE (Blue):** Dips at x=2, then slopes upward.
* **ILP-Prolog-NoisyCombo-noBCE (Orange):** Dips sharply at x=2, then slopes upward.
* **ILP-Prolog-MaxSynth-noBCE (Green):** Starts at 0, slopes steeply upward.
* **Data Points (Approximate F1 scores):**
* **x=1:** Combo ~0.47, NoisyCombo ~0.55, MaxSynth ~0.00. Black Star at ~0.62.
* **x=2:** Combo ~0.40, NoisyCombo ~0.31, MaxSynth ~0.00. Black Star at ~0.55.
* **x=4:** Combo ~0.43, NoisyCombo ~0.31, MaxSynth ~0.30. Black Star at ~0.62.
* **x=8:** Combo ~0.50, NoisyCombo ~0.57, MaxSynth ~0.58. Black Star at ~0.70.
**3. Propper MDL (Bottom-Left):**
* **Trend Verification:**
* **ILP-Scallop-Combo-noBCE (Blue):** Dips at x=2, then slopes upward.
* **ILP-Scallop-NoisyCombo-noBCE (Orange):** Dips at x=2, then slopes upward.
* **ILP-Scallop-MaxSynth-noBCE (Green):** Starts at 0, slopes steeply upward.
* **Data Points (Approximate F1 scores):**
* **x=1:** Combo ~0.63, NoisyCombo ~0.63, MaxSynth ~0.00.
* **x=2:** Combo ~0.55, NoisyCombo ~0.55, MaxSynth ~0.00.
* **x=4:** Combo ~0.59, NoisyCombo ~0.59, MaxSynth ~0.59. Black Star at ~0.62.
* **x=8:** Combo ~0.70, NoisyCombo ~0.70, MaxSynth ~0.62.
**4. Propper BCE (Bottom-Right):**
* **Trend Verification:**
* **ILP-Scallop-Combo-BCE (Blue):** Dips at x=2, then slopes upward.
* **ILP-Scallop-NoisyCombo-BCE (Orange):** Dips at x=2, then slopes upward.
* **ILP-Scallop-MaxSynth-BCE (Green):** Starts at 0, slopes steeply upward.
* **Data Points (Approximate F1 scores):**
* **x=1:** Combo ~0.63, NoisyCombo ~0.63, MaxSynth ~0.00.
* **x=2:** Combo ~0.55, NoisyCombo ~0.55, MaxSynth ~0.00.
* **x=4:** Combo ~0.59, NoisyCombo ~0.59, MaxSynth ~0.63. Black Star at ~0.62.
* **x=8:** Combo ~0.70, NoisyCombo ~0.70, MaxSynth ~0.62.
### Key Observations
1. **Performance Ceiling:** The black stars, which are consistent across all four charts at approximately (1, 0.62), (2, 0.55), (4, 0.62), and (8, 0.70), likely represent a benchmark, oracle, or upper-bound performance level for the task.
2. **Sample Size Sensitivity:** All methods show a general trend of improved F1 score with more training samples (from 1 to 8), though the rate of improvement varies significantly.
3. **Method Comparison:**
* In the "Statistical ML" chart, `SVM (ordered)` consistently outperforms standard `SVM` and `GCN`.
* The "Popper" (Prolog-based ILP) methods show high variance, with `MaxSynth` starting at zero but catching up dramatically.
* The "Propper" (Scallop-based ILP) methods, both MDL and BCE variants, start with much higher F1 scores (~0.63) at x=1 compared to other methods, suggesting better few-shot learning capability. Their `Combo` and `NoisyCombo` variants perform nearly identically.
4. **Zero-Start Phenomenon:** The `MaxSynth` variants in the ILP charts (Popper, Propper MDL, Propper BCE) all start at an F1 score of 0.0 for 1 and 2 training samples before improving, indicating a possible failure mode or initialization requirement with very small data.
### Interpretation
This set of charts provides a comparative analysis of learning efficiency across different algorithmic paradigms (Statistical ML vs. ILP) and specific implementations (GCN, SVM, Popper/Prolog, Propper/Scallop) on a task measured by F1 score.
The data suggests that for this specific task:
1. **Inductive Logic Programming (ILP) approaches, particularly those using the Scallop framework ("Propper"), demonstrate superior few-shot learning performance.** They achieve high F1 scores (~0.63) with just one training sample, whereas statistical methods start below 0.25. This implies the ILP methods are better at leveraging structural or logical constraints inherent in the problem when data is extremely scarce.
2. **The benefit of additional training samples is non-linear and method-dependent.** While all methods improve, the ILP methods show a "catch-up" dynamic, especially the `MaxSynth` strategy, which is ineffective with 1-2 samples but becomes competitive with 4-8 samples. This could indicate a threshold of data required for certain synthesis strategies to activate.
3. **The "Combo" and "NoisyCombo" strategies within the Scallop framework are robust and perform similarly,** suggesting that the core learning mechanism is stable regardless of the specific combination or noise-handling variant in this context.
4. **The consistent black stars serve as a crucial reference point,** showing that with 8 samples, several methods (notably Scallop-based ones and Popper's MaxSynth) approach or match this benchmark performance, while statistical methods remain significantly below it. This highlights the data efficiency of the logic-based approaches for this particular problem domain.
In summary, the visualization argues for the effectiveness of ILP, especially the Scallop-based "Propper" methods, in scenarios where training data is severely limited, outperforming traditional statistical ML models in sample efficiency.
DECODING INTELLIGENCE...