## Dual-Axis Error Analysis: Particle Count vs. Performance Metrics
### Overview
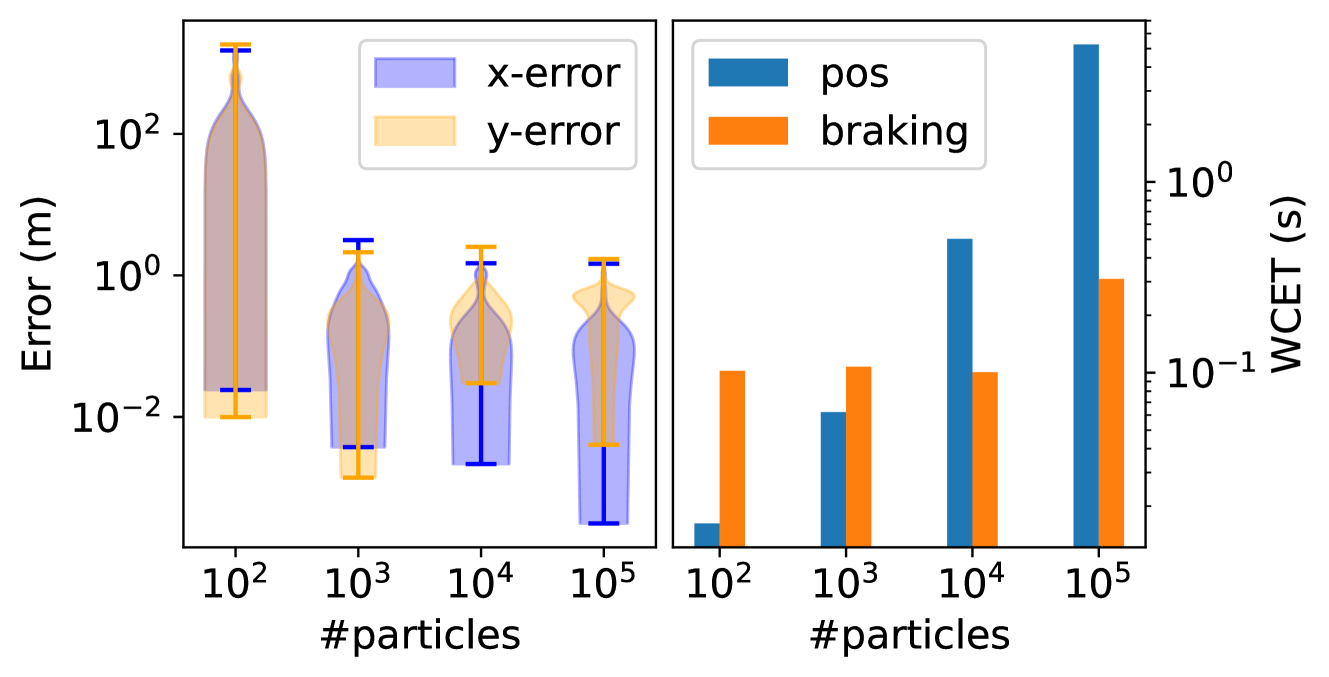
The image presents two side-by-side plots comparing error metrics and computational costs across varying particle counts (10² to 10⁵). The left plot uses violin plots to show error distributions, while the right uses bar charts for WCET comparisons.
### Components/Axes
**Left Plot (Violin Plots):**
- **X-axis**: "#particles" (log scale: 10², 10³, 10⁴, 10⁵)
- **Y-axis**: "Error (m)" (log scale: 10⁻² to 10²)
- **Legend**:
- Blue: "x-error"
- Orange: "y-error"
- **Violin Plot Features**:
- Median lines (horizontal black bars)
- Error bars (vertical blue/orange lines)
- Distribution density (shaded areas)
**Right Plot (Bar Chart):**
- **X-axis**: "#particles" (log scale: 10², 10³, 10⁴, 10⁵)
- **Y-axis**: "WCET (s)" (log scale: 10⁻¹ to 10¹)
- **Legend**:
- Blue: "pos"
- Orange: "braking"
- **Bar Features**:
- Height represents WCET magnitude
- Error bars (vertical lines at bar tops)
### Detailed Analysis
**Left Plot Trends:**
- **x-error** (blue):
- 10² particles: Median ~10⁻¹ m, range 10⁻²–10¹ m
- 10³ particles: Median ~10⁻² m, range 10⁻³–10⁻¹ m
- 10⁴ particles: Median ~10⁻³ m, range 10⁻⁴–10⁻² m
- 10⁵ particles: Median ~10⁻⁴ m, range 10⁻⁵–10⁻³ m
- **y-error** (orange):
- 10² particles: Median ~10⁻¹ m, range 10⁻²–10¹ m
- 10³ particles: Median ~10⁻² m, range 10⁻³–10⁻¹ m
- 10⁴ particles: Median ~10⁻³ m, range 10⁻⁴–10⁻² m
- 10⁵ particles: Median ~10⁻⁴ m, range 10⁻⁵–10⁻³ m
- **Key Pattern**: x-error consistently exceeds y-error by ~10× across all particle counts.
**Right Plot Trends:**
- **pos** (blue):
- 10² particles: ~10⁻¹ s
- 10³ particles: ~10⁻¹ s
- 10⁴ particles: ~10⁰ s
- 10⁵ particles: ~10¹ s
- **braking** (orange):
- 10² particles: ~10⁻¹ s
- 10³ particles: ~10⁻¹ s
- 10⁴ particles: ~10⁻¹ s
- 10⁵ particles: ~10⁰ s
- **Key Pattern**: pos WCET increases exponentially with particle count, while braking remains stable until 10⁵ particles.
### Key Observations
1. **Error Reduction**: Both x- and y-errors decrease by ~10× per decade of particle count.
2. **WCET Divergence**: pos WCET grows exponentially (10× per decade), while braking WCET plateaus until 10⁵ particles.
3. **Asymmetry**: x-error dominates y-error in magnitude across all particle counts.
### Interpretation
The data suggests a trade-off between precision and computational cost:
- **Precision**: Increasing particle count reduces positional errors (x/y) by ~10× per decade, but with diminishing returns at higher counts.
- **Computational Cost**: pos operations scale poorly with particle count (exponential growth), while braking operations remain efficient until extreme particle counts (10⁵).
- **Design Implications**: For applications requiring high precision (e.g., robotics), particle counts above 10⁴ may be impractical due to WCET constraints. The x-error/y-error asymmetry indicates potential optimization opportunities in coordinate-specific error modeling.