## Chart: Cumulative Average NLL Comparison
### Overview
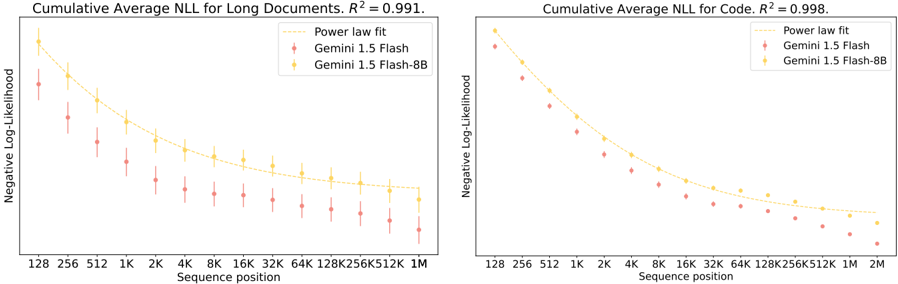
The image presents two line charts comparing the cumulative average negative log-likelihood (NLL) for two models, Gemini 1.5 Flash and Gemini 1.5 Flash-8B, across varying sequence positions. The chart on the left displays results for "Long Documents," while the chart on the right shows results for "Code." Both charts include a power law fit line.
### Components/Axes
**Left Chart (Long Documents):**
* **Title:** Cumulative Average NLL for Long Documents. R² = 0.991.
* **Y-axis:** Negative Log-Likelihood
* **X-axis:** Sequence position (128, 256, 512, 1K, 2K, 4K, 8K, 16K, 32K, 64K, 128K, 256K, 512K, 1M)
* **Legend (Top-Right):**
* Power law fit (dashed yellow line)
* Gemini 1.5 Flash (red markers)
* Gemini 1.5 Flash-8B (yellow markers)
**Right Chart (Code):**
* **Title:** Cumulative Average NLL for Code. R² = 0.998.
* **Y-axis:** Negative Log-Likelihood
* **X-axis:** Sequence position (128, 256, 512, 1K, 2K, 4K, 8K, 16K, 32K, 64K, 128K, 256K, 512K, 1M, 2M)
* **Legend (Top-Right):**
* Power law fit (dashed yellow line)
* Gemini 1.5 Flash (red markers)
* Gemini 1.5 Flash-8B (yellow markers)
### Detailed Analysis
**Left Chart (Long Documents):**
* **Gemini 1.5 Flash (Red):** The NLL decreases as the sequence position increases. Error bars are present, indicating variability in the data.
* 128: ~1.25
* 1K: ~0.75
* 1M: ~0.35
* **Gemini 1.5 Flash-8B (Yellow):** The NLL also decreases as the sequence position increases, and is generally lower than Gemini 1.5 Flash.
* 128: ~1.75
* 1K: ~0.9
* 1M: ~0.4
* **Power Law Fit (Yellow Dashed):** The power law fit line closely follows the trend of the Gemini 1.5 Flash-8B data.
**Right Chart (Code):**
* **Gemini 1.5 Flash (Red):** The NLL decreases as the sequence position increases.
* 128: ~1.1
* 1K: ~0.4
* 2M: ~0.1
* **Gemini 1.5 Flash-8B (Yellow):** The NLL decreases as the sequence position increases, and is generally lower than Gemini 1.5 Flash.
* 128: ~1.5
* 1K: ~0.5
* 2M: ~0.15
* **Power Law Fit (Yellow Dashed):** The power law fit line closely follows the trend of the Gemini 1.5 Flash-8B data.
### Key Observations
* In both charts, the Gemini 1.5 Flash-8B model consistently exhibits lower NLL values compared to the Gemini 1.5 Flash model, indicating better performance.
* The NLL decreases with increasing sequence position for both models and both data types (Long Documents and Code).
* The power law fit provides a good approximation of the NLL trend, as indicated by the high R² values (0.991 for Long Documents and 0.998 for Code).
* The error bars on the "Long Documents" chart suggest more variability in the NLL for that dataset compared to the "Code" dataset.
### Interpretation
The charts demonstrate that the Gemini 1.5 Flash-8B model outperforms the Gemini 1.5 Flash model in terms of negative log-likelihood for both long documents and code. The decreasing NLL with increasing sequence position suggests that both models become more accurate in predicting subsequent tokens as the sequence length grows. The high R² values for the power law fit indicate that a power law function can effectively model the relationship between sequence position and NLL. The lower NLL values for the 8B model suggest that the larger model size contributes to improved performance. The error bars in the "Long Documents" chart may indicate that long documents have more inherent variability or complexity compared to code, leading to greater uncertainty in the NLL.