## Chart: Cumulative Average Negative Log-Likelihood (NLL) vs. Sequence Position
### Overview
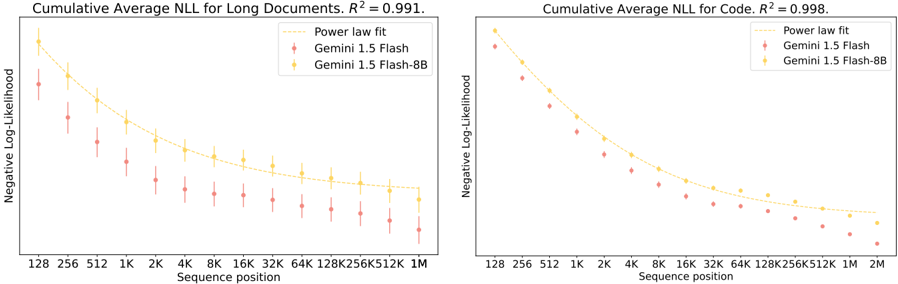
The image presents two charts displaying Cumulative Average Negative Log-Likelihood (NLL) as a function of Sequence Position. The left chart focuses on "Long Documents" with an R-squared value of 0.991, while the right chart focuses on "Code" with an R-squared value of 0.998. Both charts compare the performance of "Gemini 1.5 Flash" and "Gemini 1.5 Flash-8B" models against a "Power law fit". The data is presented as scatter plots with error bars, overlaid with a smoothed curve representing the power law fit.
### Components/Axes
* **X-axis (Both Charts):** Sequence position, labeled with values: 128, 256, 512, 1K, 2K, 4K, 8K, 16K, 32K, 64K, 128K, 256K, 512K, 1M (left chart) and 1M, 2M (right chart). "K" denotes thousands, and "M" denotes millions.
* **Y-axis (Both Charts):** Negative Log-Likelihood, with no explicit scale provided, but values appear to range from approximately 2 to 6.
* **Legend (Both Charts):** Located in the top-right corner.
* Power law fit (Solid yellow line)
* Gemini 1.5 Flash (Red scatter points with error bars)
* Gemini 1.5 Flash-8B (Orange scatter points with error bars)
* **Title (Left Chart):** "Cumulative Average NLL for Long Documents. R² = 0.991."
* **Title (Right Chart):** "Cumulative Average NLL for Code. R² = 0.998."
### Detailed Analysis
**Left Chart (Long Documents):**
* **Power Law Fit:** The yellow line shows a steep downward trend from approximately 5.5 at a sequence position of 128 to approximately 2.2 at a sequence position of 1M.
* **Gemini 1.5 Flash:** The red scatter points exhibit a similar downward trend, but with more variability.
* At 128: Approximately 5.8 ± 0.3
* At 256: Approximately 5.2 ± 0.3
* At 512: Approximately 4.7 ± 0.2
* At 1K: Approximately 4.2 ± 0.2
* At 2K: Approximately 3.8 ± 0.2
* At 4K: Approximately 3.4 ± 0.2
* At 8K: Approximately 3.0 ± 0.2
* At 16K: Approximately 2.8 ± 0.2
* At 32K: Approximately 2.6 ± 0.2
* At 64K: Approximately 2.4 ± 0.2
* At 128K: Approximately 2.3 ± 0.2
* At 256K: Approximately 2.2 ± 0.2
* At 512K: Approximately 2.2 ± 0.2
* At 1M: Approximately 2.2 ± 0.2
* **Gemini 1.5 Flash-8B:** The orange scatter points also follow a downward trend, but generally have lower NLL values than Gemini 1.5 Flash, especially at higher sequence positions.
* At 128: Approximately 5.5 ± 0.3
* At 256: Approximately 4.9 ± 0.2
* At 512: Approximately 4.4 ± 0.2
* At 1K: Approximately 4.0 ± 0.2
* At 2K: Approximately 3.6 ± 0.2
* At 4K: Approximately 3.2 ± 0.2
* At 8K: Approximately 2.9 ± 0.2
* At 16K: Approximately 2.7 ± 0.2
* At 32K: Approximately 2.5 ± 0.2
* At 64K: Approximately 2.3 ± 0.2
* At 128K: Approximately 2.2 ± 0.2
* At 256K: Approximately 2.1 ± 0.2
* At 512K: Approximately 2.1 ± 0.2
* At 1M: Approximately 2.1 ± 0.2
**Right Chart (Code):**
* **Power Law Fit:** The yellow line shows a steep downward trend from approximately 5.5 at a sequence position of 128 to approximately 2.0 at a sequence position of 2M.
* **Gemini 1.5 Flash:** The red scatter points exhibit a similar downward trend, but with more variability.
* At 128: Approximately 5.4 ± 0.3
* At 256: Approximately 4.9 ± 0.2
* At 512: Approximately 4.4 ± 0.2
* At 1K: Approximately 4.0 ± 0.2
* At 2K: Approximately 3.6 ± 0.2
* At 4K: Approximately 3.2 ± 0.2
* At 8K: Approximately 2.9 ± 0.2
* At 16K: Approximately 2.6 ± 0.2
* At 32K: Approximately 2.4 ± 0.2
* At 64K: Approximately 2.2 ± 0.2
* At 128K: Approximately 2.1 ± 0.2
* At 256K: Approximately 2.0 ± 0.2
* At 512K: Approximately 2.0 ± 0.2
* At 1M: Approximately 2.0 ± 0.2
* At 2M: Approximately 2.0 ± 0.2
* **Gemini 1.5 Flash-8B:** The orange scatter points also follow a downward trend, but generally have lower NLL values than Gemini 1.5 Flash, especially at higher sequence positions.
* At 128: Approximately 5.2 ± 0.3
* At 256: Approximately 4.7 ± 0.2
* At 512: Approximately 4.2 ± 0.2
* At 1K: Approximately 3.8 ± 0.2
* At 2K: Approximately 3.4 ± 0.2
* At 4K: Approximately 3.0 ± 0.2
* At 8K: Approximately 2.7 ± 0.2
* At 16K: Approximately 2.5 ± 0.2
* At 32K: Approximately 2.3 ± 0.2
* At 64K: Approximately 2.1 ± 0.2
* At 128K: Approximately 2.0 ± 0.2
* At 256K: Approximately 2.0 ± 0.2
* At 512K: Approximately 2.0 ± 0.2
* At 1M: Approximately 2.0 ± 0.2
* At 2M: Approximately 2.0 ± 0.2
### Key Observations
* Both charts demonstrate a strong negative correlation between sequence position and NLL, indicating that the models perform better (lower NLL) as the sequence length increases.
* The R-squared values (0.991 and 0.998) confirm a very strong fit of the power law to the data.
* Gemini 1.5 Flash-8B consistently outperforms Gemini 1.5 Flash, particularly at longer sequence positions.
* The error bars indicate some variability in the NLL values, but the overall trends are clear.
### Interpretation
These charts demonstrate the scaling behavior of the Gemini 1.5 Flash models. The negative log-likelihood decreasing with sequence position indicates that the models are able to better predict the next token in a sequence as they process more context. The power law fit suggests that this improvement follows a predictable pattern. The superior performance of Gemini 1.5 Flash-8B, especially at longer sequence lengths, suggests that the smaller model benefits more from increased context. The high R-squared values indicate that the power law is a good model for predicting the performance of these models at different sequence lengths. The difference in R-squared values between the two charts (0.991 vs 0.998) might suggest that the power law fit is slightly better for code than for long documents, or that the data for code is less noisy. The charts provide strong evidence that these models exhibit strong scaling properties, making them well-suited for processing long sequences of text and code.