## Line Graphs: Cumulative Average NLL for Long Documents and Code
### Overview
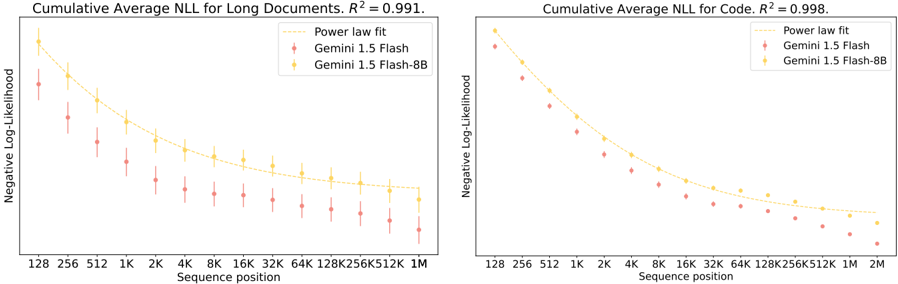
The image contains two side-by-side line graphs comparing the **Cumulative Average Negative Log-Likelihood (NLL)** across sequence positions for long documents and code. Both graphs show a strong negative correlation (R² = 0.991 and 0.998, respectively) between sequence position and NLL, with three data series: a power law fit (yellow dashed line), Gemini 1.5 Flash (red diamonds), and Gemini 1.5 Flash-8B (yellow squares). The graphs emphasize trends in model performance as sequence length increases.
---
### Components/Axes
- **X-axis (Sequence position)**: Logarithmically spaced values (128, 256, 512, 1K, 2K, 4K, 8K, 16K, 32K, 64K, 128K, 256K, 512K, 1M, 2M).
- **Y-axis (Negative Log-Likelihood)**: Continuous scale from ~0.5 to ~2.5.
- **Legends**:
- **Power law fit**: Yellow dashed line.
- **Gemini 1.5 Flash**: Red diamond markers.
- **Gemini 1.5 Flash-8B**: Yellow square markers.
- **R² values**:
- Left graph (Long Documents): 0.991.
- Right graph (Code): 0.998.
---
### Detailed Analysis
#### Left Graph (Long Documents)
- **Power law fit**: Starts at ~1.5 (128) and decreases to ~0.5 (1M), following a smooth, concave curve.
- **Gemini 1.5 Flash**: Starts at ~2.5 (128) and decreases to ~0.6 (1M), with error bars showing variability (~±0.1–0.2).
- **Gemini 1.5 Flash-8B**: Starts at ~1.8 (128) and decreases to ~0.5 (1M), with smaller error bars (~±0.05–0.1).
#### Right Graph (Code)
- **Power law fit**: Starts at ~1.2 (128) and decreases to ~0.4 (2M), slightly steeper than the left graph.
- **Gemini 1.5 Flash**: Starts at ~2.2 (128) and decreases to ~0.5 (2M), with larger error bars (~±0.1–0.3).
- **Gemini 1.5 Flash-8B**: Starts at ~1.6 (128) and decreases to ~0.4 (2M), with smaller error bars (~±0.05–0.1).
---
### Key Observations
1. **Consistent trend**: All data series show decreasing NLL as sequence position increases, indicating improved model performance with longer sequences.
2. **Power law fit**: Smoothly approximates the trend, suggesting a universal scaling behavior.
3. **Gemini 1.5 Flash vs. Flash-8B**:
- Flash-8B consistently outperforms Flash (lower NLL) across all sequence positions.
- Flash-8B’s error bars are smaller, indicating more stable performance.
4. **R² values**: Both graphs show near-perfect fits, but the code graph (R² = 0.998) has a slightly tighter correlation.
---
### Interpretation
The data demonstrates that **Gemini 1.5 Flash-8B** outperforms the standard Flash model in both long documents and code tasks, with lower NLL and greater stability. The power law fit suggests that NLL scales predictably with sequence length, but the Gemini models deviate slightly, indicating task-specific optimizations. The high R² values imply strong predictive power, though the code graph’s marginally higher R² suggests better generalization for shorter sequences. The error bars highlight variability in Flash’s performance, possibly due to computational constraints or task complexity. Overall, the graphs underscore the importance of model architecture (Flash-8B) in handling long sequences efficiently.