## Line Chart: Predicting Final Outcome
### Overview
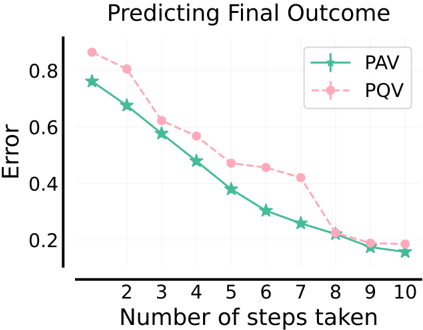
The image is a line chart comparing the error rates of two methods, PAV and PQV, in predicting a final outcome, as the number of steps taken increases. Both methods show a decreasing error rate as more steps are taken.
### Components/Axes
* **Title:** Predicting Final Outcome
* **X-axis:** Number of steps taken, with values ranging from 2 to 10 in increments of 1.
* **Y-axis:** Error, with values ranging from 0.2 to 0.8 in increments of 0.2.
* **Legend:** Located in the top-right corner.
* PAV (green line with star markers)
* PQV (pink dashed line with circle markers)
### Detailed Analysis
* **PAV (green line with star markers):**
* Trend: The error rate decreases as the number of steps increases.
* Data Points:
* 2 steps: approximately 0.77
* 3 steps: approximately 0.68
* 4 steps: approximately 0.58
* 5 steps: approximately 0.48
* 6 steps: approximately 0.38
* 7 steps: approximately 0.27
* 8 steps: approximately 0.22
* 9 steps: approximately 0.17
* 10 steps: approximately 0.15
* **PQV (pink dashed line with circle markers):**
* Trend: The error rate decreases as the number of steps increases, but the decrease slows down after 7 steps.
* Data Points:
* 2 steps: approximately 0.87
* 3 steps: approximately 0.81
* 4 steps: approximately 0.63
* 5 steps: approximately 0.57
* 6 steps: approximately 0.48
* 7 steps: approximately 0.45
* 8 steps: approximately 0.42
* 9 steps: approximately 0.20
* 10 steps: approximately 0.19
### Key Observations
* Both PAV and PQV show a decrease in error as the number of steps increases.
* PAV consistently has a lower error rate than PQV for the same number of steps.
* The error reduction for PQV slows down significantly after 7 steps.
* Both methods appear to converge to a similar error rate as the number of steps approaches 10.
### Interpretation
The chart suggests that both PAV and PQV methods become more accurate in predicting the final outcome as they take more steps. However, PAV appears to be more efficient, achieving lower error rates with fewer steps compared to PQV. The diminishing returns observed in PQV after 7 steps indicate that increasing the number of steps beyond this point may not significantly improve its accuracy. The convergence of both methods at higher step counts suggests a potential limit to the accuracy achievable with either method.