## 3D Surface Plots: Twisting Surfaces
### Overview
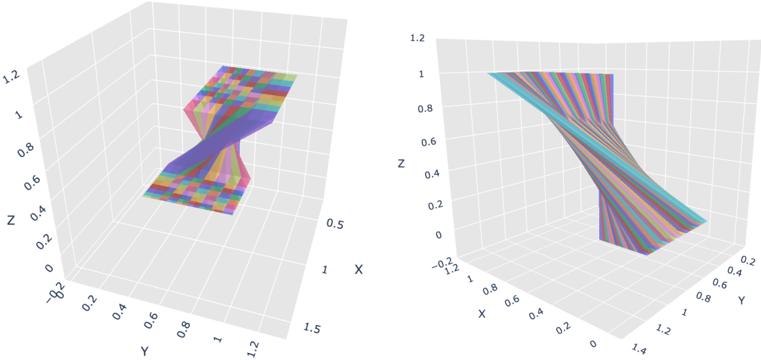
The image contains two 3D surface plots, each depicting a series of twisting surfaces. The plots share similar axes and scales but offer different perspectives on the same or related data. The surfaces are represented by multiple colored lines, creating a visual effect of twisting or spiraling.
### Components/Axes
Both plots share the following characteristics:
* **Axes:** Each plot has three axes labeled X, Y, and Z.
* **X-Axis:** The X-axis ranges from approximately -0.2 to 1.5.
* **Y-Axis:** The Y-axis ranges from approximately -0.2 to 1.2.
* **Z-Axis:** The Z-axis ranges from approximately -0.2 to 1.2.
* **Gridlines:** Both plots have gridlines along each axis to aid in visualization.
* **Surfaces:** Multiple colored lines represent the surfaces. The colors vary, but there is no explicit legend.
### Detailed Analysis
**Left Plot:**
* **Orientation:** The plot is oriented such that the viewer sees the surfaces twisting around a central point.
* **Surface Shape:** The surfaces appear to start as a flat plane, twist inward towards the center, and then expand outward again, creating an hourglass-like shape.
* **Color Variation:** The surfaces are represented by a range of colors, including blues, greens, yellows, oranges, and reds. The colors seem to be assigned sequentially to each surface.
* **X-Y Plane:** The surfaces appear to be defined on a grid in the X-Y plane.
**Right Plot:**
* **Orientation:** The plot is oriented to show a side view of the twisting surfaces.
* **Surface Shape:** From this perspective, the surfaces appear to start as a flat plane, twist upwards and to the side, and then flatten out again at the top.
* **Color Variation:** Similar to the left plot, the surfaces are represented by a range of colors.
* **X-Y Plane:** The surfaces appear to be defined on a grid in the X-Y plane.
### Key Observations
* **Twisting Behavior:** Both plots clearly show the twisting nature of the surfaces.
* **Symmetry:** The left plot suggests a degree of symmetry around the Z-axis.
* **Perspective:** The two plots provide complementary perspectives, aiding in understanding the 3D shape of the surfaces.
### Interpretation
The plots visualize a set of surfaces that undergo a twisting transformation. The left plot emphasizes the overall shape and symmetry, while the right plot highlights the twisting motion from a side view. The absence of a legend makes it difficult to determine the exact meaning of the different colors, but they likely represent different parameters or iterations of the twisting process. The data suggests a continuous transformation of a surface from a flat plane to a twisted shape and back to a flat plane. The plots are useful for understanding the spatial characteristics of this transformation.