\n
## 3D Surface Plots: Torus-like Structures
### Overview
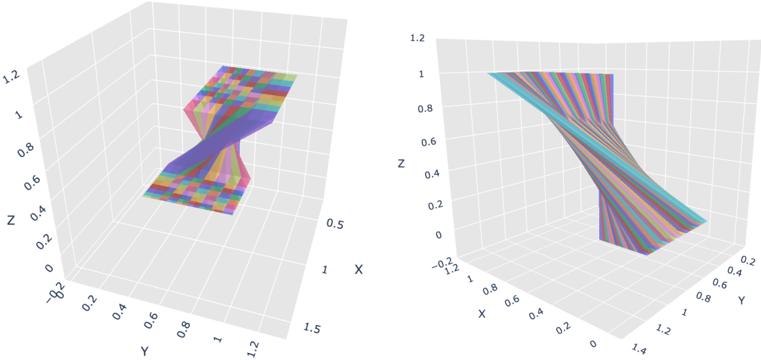
The image presents two 3D surface plots, both depicting a torus-like structure. The plots are visually similar, differing primarily in the orientation and color scheme used to represent the surface. Both plots utilize a Cartesian coordinate system (X, Y, Z) to define the spatial arrangement of the structure. The plots do not contain explicit data tables or numerical values, but rather visualize a continuous surface.
### Components/Axes
Both plots share the following components:
* **Axes:**
* X-axis: Ranges approximately from -0.2 to 1.4 (right plot) and 0.0 to 1.5 (left plot).
* Y-axis: Ranges approximately from -0.2 to 0.2 (right plot) and 0.0 to 1.2 (left plot).
* Z-axis: Ranges approximately from 0.0 to 1.2 in both plots.
* **Coordinate System:** Cartesian (X, Y, Z).
* **Surface:** A torus-like shape, with a central hole.
* **Coloring:** The surface is colored using a gradient of colors, which appears to represent the height or value of the surface at each point.
### Detailed Analysis or Content Details
**Left Plot:**
* The torus is oriented such that the hole is roughly aligned with the Y-axis.
* The color gradient transitions from shades of red and orange (lower Z values) to purple and blue (higher Z values).
* The X-axis extends from approximately 0.0 to 1.5.
* The Y-axis extends from approximately 0.0 to 1.2.
* The Z-axis extends from approximately 0.0 to 1.2.
**Right Plot:**
* The torus is rotated compared to the left plot, with the hole oriented more diagonally.
* The color gradient is more diverse, including greens, yellows, and blues.
* The X-axis extends from approximately -0.2 to 1.4.
* The Y-axis extends from approximately -0.2 to 0.2.
* The Z-axis extends from approximately 0.0 to 1.2.
Both plots show a continuous surface with no sharp edges or discontinuities. The color variations suggest a smooth change in the surface's height or value.
### Key Observations
* The two plots represent the same underlying torus-like structure, but viewed from different angles and with different color schemes.
* The color gradients are used to visually represent the surface's height or value, with warmer colors generally indicating lower values and cooler colors indicating higher values.
* The plots do not provide specific numerical data points, but rather a visual representation of a continuous surface.
### Interpretation
The image demonstrates a visualization of a 3D torus-like surface. The use of color gradients allows for a quick understanding of the surface's shape and height variations. The two different orientations suggest an exploration of the structure from multiple viewpoints. The absence of explicit data points indicates that the image is intended to convey a general understanding of the shape rather than precise numerical values. The plots could represent a mathematical function, a physical object, or a simulation result. Without additional context, it is difficult to determine the specific meaning or application of the visualization. The plots are likely generated from a parametric equation defining the torus shape. The different color schemes could be used to highlight different features of the surface or to improve visual clarity.