## 3D Surface Plots: Comparative Analysis
### Overview
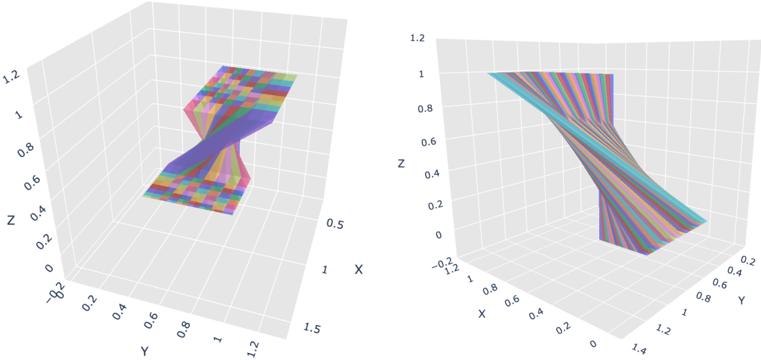
The image contains two side-by-side 3D surface plots with distinct geometric configurations. Both plots use a color gradient (purple to green) to represent surface elevation or a related parameter. The left plot exhibits a saddle-shaped surface with a central peak, while the right plot displays a helical/spiral structure descending diagonally across the plot.
### Components/Axes
**Left Plot:**
- **X-axis**: Labeled "X", range [-0.2, 1.5], increments of 0.2
- **Y-axis**: Labeled "Y", range [0, 1.2], increments of 0.2
- **Z-axis**: Labeled "Z", range [0, 1.2], increments of 0.2
- **Grid**: Fine grid lines visible on all planes
- **Color Gradient**: Purple (lowest elevation) to green (highest elevation)
**Right Plot:**
- **X-axis**: Labeled "X", range [0, 1.4], increments of 0.2
- **Y-axis**: Labeled "Y", range [0, 1.4], increments of 0.2
- **Z-axis**: Labeled "Z", range [0, 1.4], increments of 0.2
- **Grid**: Fine grid lines visible on all planes
- **Color Gradient**: Purple (lowest elevation) to green (highest elevation)