## Bar Chart: Prompt Length Comparison Across Compression Strategies
### Overview
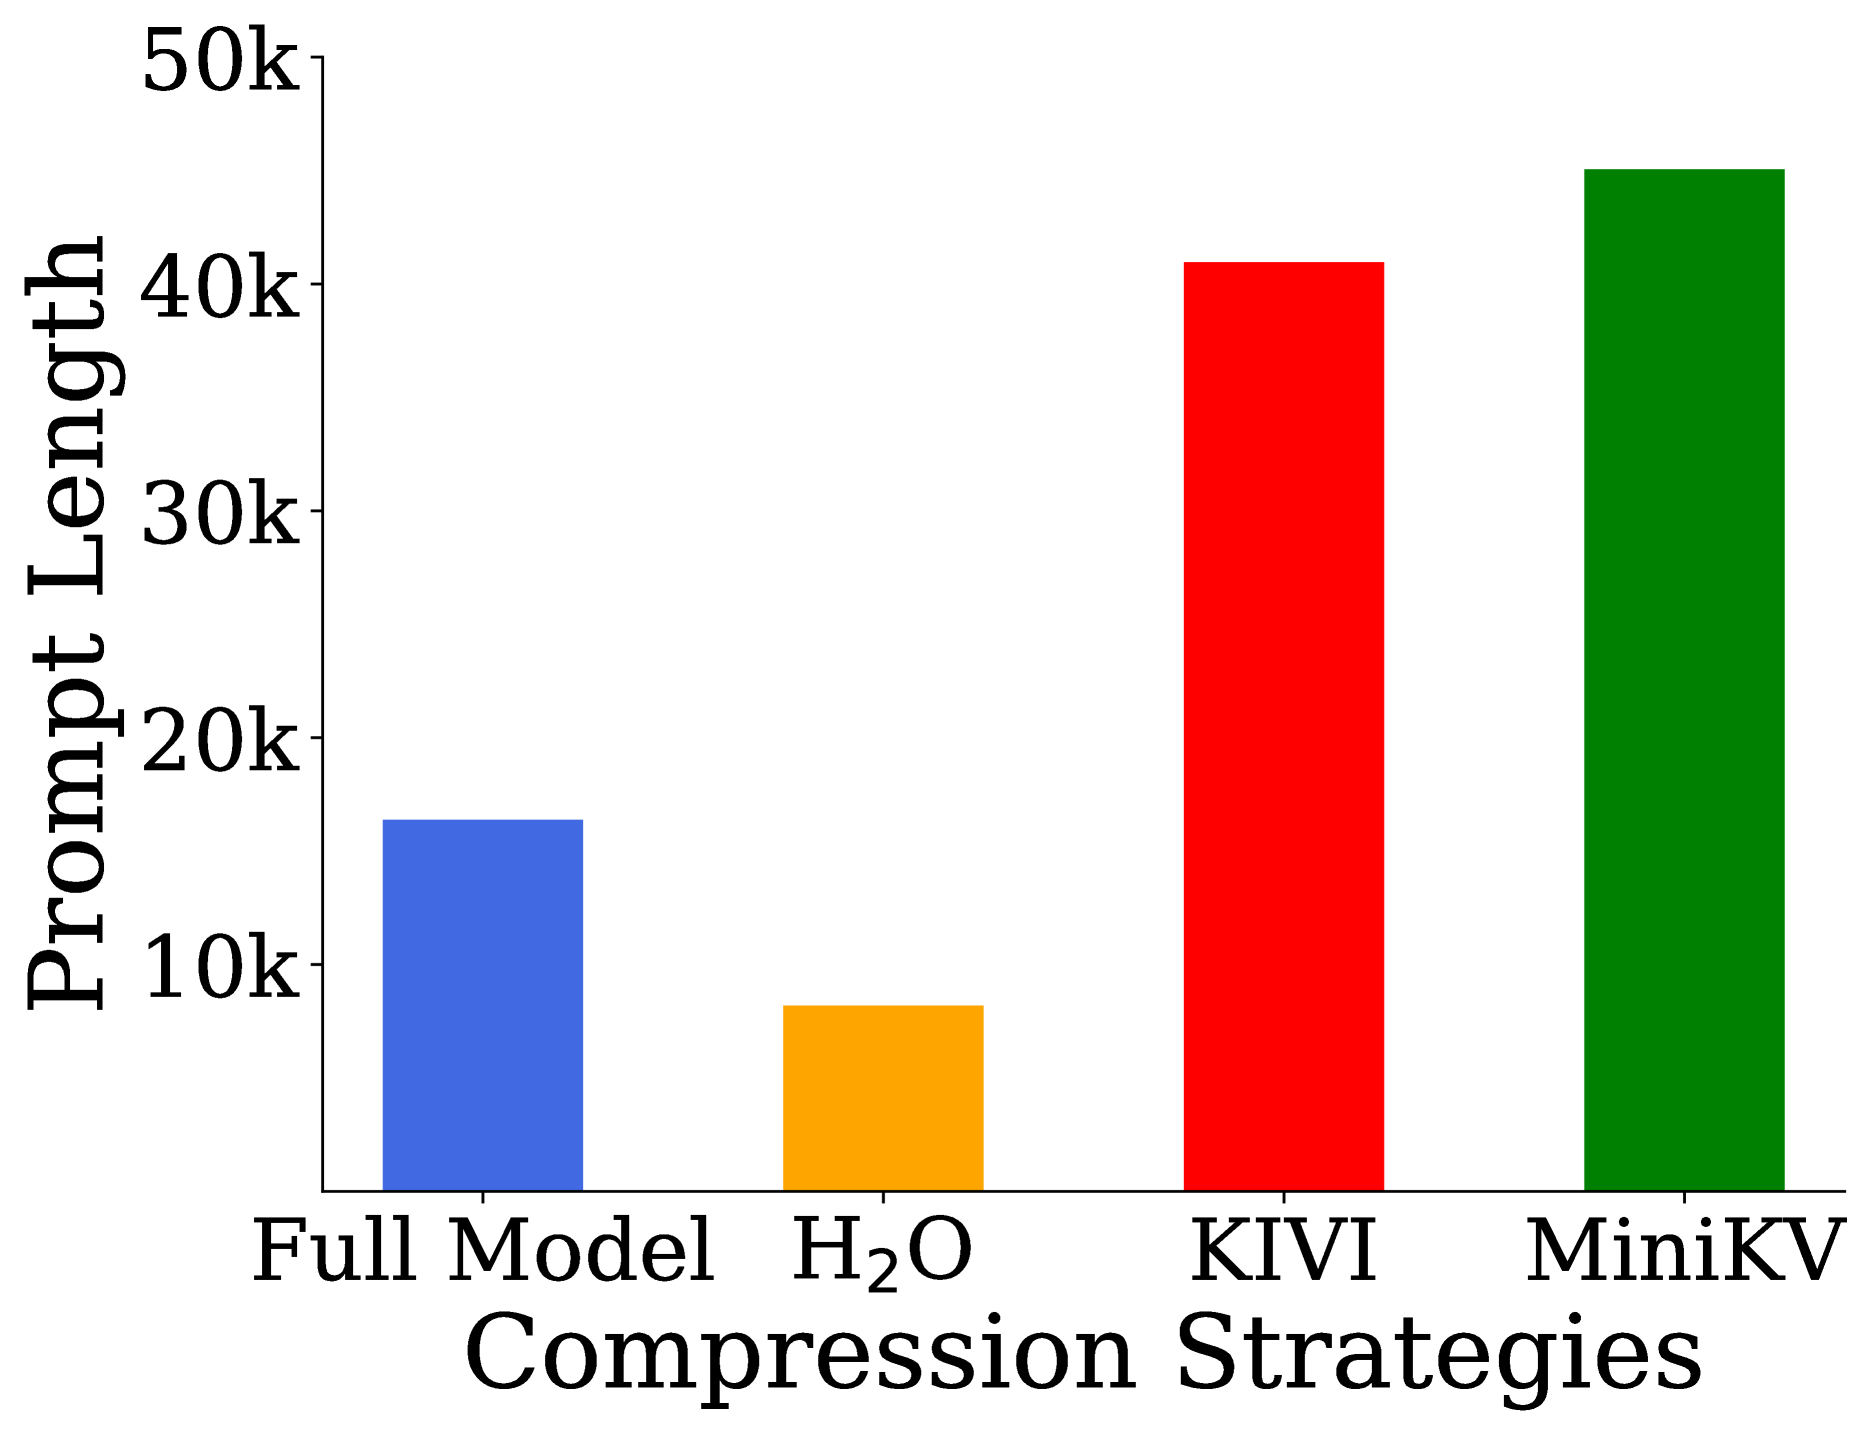
The chart compares prompt lengths (in thousands) for four compression strategies: Full Model, H₂O, KIVI, and MiniKV. Prompt lengths are measured on a logarithmic scale from 10k to 50k.
### Components/Axes
- **X-axis**: Compression Strategies (categorical: Full Model, H₂O, KIVI, MiniKV)
- **Y-axis**: Prompt Length (logarithmic scale: 10k, 20k, 30k, 40k, 50k)
- **Legend**: Located at the bottom, mapping colors to strategies:
- Blue: Full Model
- Orange: H₂O
- Red: KIVI
- Green: MiniKV
### Detailed Analysis
1. **Full Model** (Blue):
- Prompt length ≈ 16k
- Bar height reaches ~16,000 on the y-axis.
2. **H₂O** (Orange):
- Prompt length ≈ 8k
- Bar height reaches ~8,000 on the y-axis.
3. **KIVI** (Red):
- Prompt length ≈ 41k
- Bar height reaches ~41,000 on the y-axis.
4. **MiniKV** (Green):
- Prompt length ≈ 45k
- Bar height reaches ~45,000 on the y-axis.
### Key Observations
- **H₂O** has the shortest prompt length (~8k), significantly lower than the Full Model (~16k).
- **MiniKV** has the longest prompt length (~45k), nearly tripling the Full Model's length.
- **KIVI** (~41k) and **MiniKV** (~45k) show similar magnitudes, both far exceeding the Full Model.
- The logarithmic y-axis emphasizes the disparity between H₂O and the other strategies.
### Interpretation
The data suggests that compression strategies drastically alter prompt length. H₂O achieves the most aggressive compression (halving the Full Model's length), while MiniKV introduces the greatest expansion (~2.8x the Full Model). This implies trade-offs between compression efficiency and data retention or processing overhead. The logarithmic scale highlights exponential differences, particularly between H₂O and the other strategies. The Full Model serves as a baseline, with H₂O optimizing for brevity and MiniKV prioritizing other factors (e.g., accuracy or speed) at the cost of length.