TECHNICAL ASSET FINGERPRINT
d00691007402d2e9b98960d9
Click to view fullscreen
Press ESC or click to close
FOUND IN PAPERS
EXPERT: nemotron-free VERSION 1
RUNTIME: free/nvidia/nemotron-nano-12b-v2-vl:free
INTEL_VERIFIED
# Technical Document Analysis of Image: Astrophysical Data Visualization
## Overview
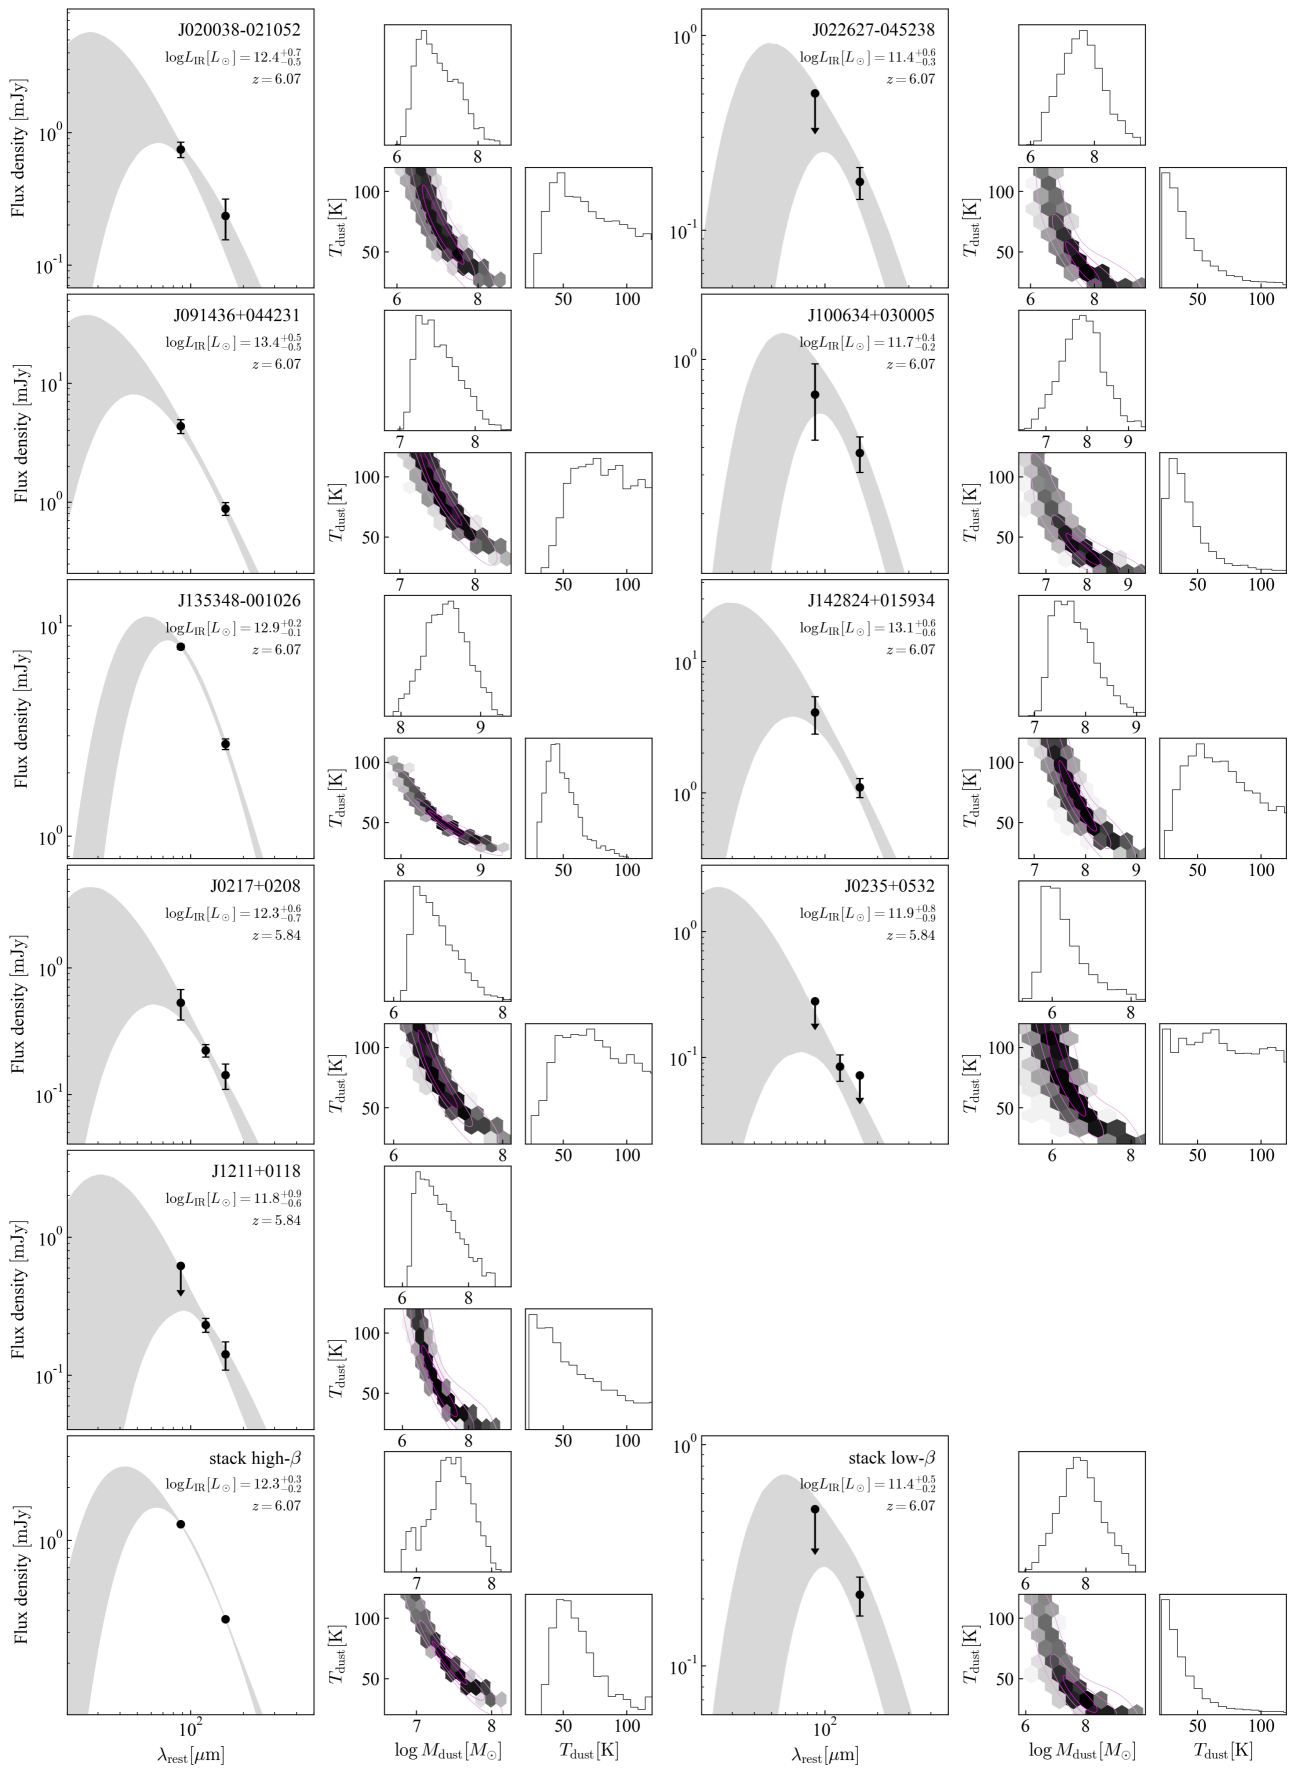
The image contains **12 panels** organized into **two columns** (left and right), each depicting **three subplots per panel**:
1. **Main Plot**: Flux density vs. wavelength (λ_rest) with a shaded confidence interval.
2. **Hexbin Plot**: Dust temperature (T_dust) vs. dust mass (log M_dust).
3. **Histograms**: Distributions of T_dust and log M_dust.
Each panel is labeled with a unique identifier (e.g., J200038-021052, J091436+044231) and includes **log L_IR** (intrinsic infrared luminosity) and **z** (redshift) values. The bottom panels include labels for "stack high-β" and "stack low-β" with distinct log L_IR and z values.
---
## Left Column: Panels J200038-021052 to J211+0118
### Panel 1: J200038-021052
- **Main Plot**:
- **x-axis**: λ_rest (μm) from 10¹ to 10².
- **y-axis**: Flux density (mJy) from 10⁻¹ to 10¹.
- **Shaded Area**: Confidence interval (gray).
- **Black Line**: Central flux density trend.
- **Error Bars**: Vertical error bars at specific λ_rest values.
- **Text**: `log L_IR[L_☉] = 12.4+0.7−0.5`, `z = 6.07`.
- **Hexbin Plot**:
- **x-axis**: log M_dust (M_☉) from 5 to 100.
- **y-axis**: T_dust (K) from 50 to 100.
- **Color Gradient**: Darker shades indicate higher density.
- **Histograms**:
- **T_dust (K)**: Bins from 50 to 100.
- **log M_dust (M_☉)**: Bins from 5 to 100.
### Panel 2: J091436+044231
- **Main Plot**:
- **x-axis**: λ_rest (μm) from 10¹ to 10².
- **y-axis**: Flux density (mJy) from 10⁰ to 10¹.
- **Shaded Area**: Confidence interval (gray).
- **Black Line**: Central flux density trend.
- **Error Bars**: Vertical error bars at specific λ_rest values.
- **Text**: `log L_IR[L_☉] = 13.4+0.5−0.5`, `z = 6.07`.
- **Hexbin Plot**:
- **x-axis**: log M_dust (M_☉) from 5 to 100.
- **y-axis**: T_dust (K) from 50 to 100.
- **Color Gradient**: Darker shades indicate higher density.
- **Histograms**:
- **T_dust (K)**: Bins from 50 to 100.
- **log M_dust (M_☉)**: Bins from 5 to 100.
### Panel 3: J135348-001026
- **Main Plot**:
- **x-axis**: λ_rest (μm) from 10¹ to 10².
- **y-axis**: Flux density (mJy) from 10⁰ to 10¹.
- **Shaded Area**: Confidence interval (gray).
- **Black Line**: Central flux density trend.
- **Error Bars**: Vertical error bars at specific λ_rest values.
- **Text**: `log L_IR[L_☉] = 12.9+0.2−0.1`, `z = 6.07`.
- **Hexbin Plot**:
- **x-axis**: log M_dust (M_☉) from 5 to 100.
- **y-axis**: T_dust (K) from 50 to 100.
- **Color Gradient**: Darker shades indicate higher density.
- **Histograms**:
- **T_dust (K)**: Bins from 50 to 100.
- **log M_dust (M_☉)**: Bins from 5 to 100.
### Panel 4: J0217+0208
- **Main Plot**:
- **x-axis**: λ_rest (μm) from 10¹ to 10².
- **y-axis**: Flux density (mJy) from 10⁻¹ to 10⁰.
- **Shaded Area**: Confidence interval (gray).
- **Black Line**: Central flux density trend.
- **Error Bars**: Vertical error bars at specific λ_rest values.
- **Text**: `log L_IR[L_☉] = 12.3+0.6−0.7`, `z = 5.84`.
- **Hexbin Plot**:
- **x-axis**: log M_dust (M_☉) from 5 to 100.
- **y-axis**: T_dust (K) from 50 to 100.
- **Color Gradient**: Darker shades indicate higher density.
- **Histograms**:
- **T_dust (K)**: Bins from 50 to 100.
- **log M_dust (M_☉)**: Bins from 5 to 100.
### Panel 5: J1211+0118
- **Main Plot**:
- **x-axis**: λ_rest (μm) from 10¹ to 10².
- **y-axis**: Flux density (mJy) from 10⁻¹ to 10⁰.
- **Shaded Area**: Confidence interval (gray).
- **Black Line**: Central flux density trend.
- **Error Bars**: Vertical error bars at specific λ_rest values.
- **Text**: `log L_IR[L_☉] = 11.8+0.9−0.6`, `z = 5.84`.
- **Hexbin Plot**:
- **x-axis**: log M_dust (M_☉) from 5 to 100.
- **y-axis**: T_dust (K) from 50 to 100.
- **Color Gradient**: Darker shades indicate higher density.
- **Histograms**:
- **T_dust (K)**: Bins from 50 to 100.
- **log M_dust (M_☉)**: Bins from 5 to 100.
### Panel 6: Stack High-β
- **Main Plot**:
- **x-axis**: λ_rest (μm) from 10¹ to 10².
- **y-axis**: Flux density (mJy) from 10⁰ to 10¹.
- **Shaded Area**: Confidence interval (gray).
- **Black Line**: Central flux density trend.
- **Error Bars**: Vertical error bars at specific λ_rest values.
- **Text**: `log L_IR[L_☉] = 12.3+0.3−0.2`, `z = 6.07`.
- **Hexbin Plot**:
- **x-axis**: log M_dust (M_☉) from 5 to 100.
- **y-axis**: T_dust (K) from 50 to 100.
- **Color Gradient**: Darker shades indicate higher density.
- **Histograms**:
- **T_dust (K)**: Bins from 50 to 100.
- **log M_dust (M_☉)**: Bins from 5 to 100.
---
## Right Column: Panels J022627-045238 to J142824+015934
### Panel 1: J022627-045238
- **Main Plot**:
- **x-axis**: λ_rest (μm) from 10¹ to 10².
- **y-axis**: Flux density (mJy) from 10⁻¹ to 10¹.
- **Shaded Area**: Confidence interval (gray).
- **Black Line**: Central flux density trend.
- **Error Bars**: Vertical error bars at specific λ_rest values.
- **Text**: `log L_IR[L_☉] = 11.4+0.6−0.3`, `z = 6.07`.
- **Hexbin Plot**:
- **x-axis**: log M_dust (M_☉) from 5 to 100.
- **y-axis**: T_dust (K) from 50 to 100.
- **Color Gradient**: Darker shades indicate higher density.
- **Histograms**:
- **T_dust (K)**: Bins from 50 to 100.
- **log M_dust (M_☉)**: Bins from 5 to 100.
### Panel 2: J100634+030005
- **Main Plot**:
- **x-axis**: λ_rest (μm) from 10¹ to 10².
- **y-axis**: Flux density (mJy) from 10⁰ to 10¹.
- **Shaded Area**: Confidence interval (gray).
- **Black Line**: Central flux density trend.
- **Error Bars**: Vertical error bars at specific λ_rest values.
- **Text**: `log L_IR[L_☉] = 11.7+0.4−0.2`, `z = 6.07`.
- **Hexbin Plot**:
- **x-axis**: log M_dust (M_☉) from 5 to 100.
- **y-axis**: T_dust (K) from 50 to 100.
- **Color Gradient**: Darker shades indicate higher density.
- **Histograms**:
- **T_dust (K)**: Bins from 50 to 100.
- **log M_dust (M_☉)**: Bins from 5 to 100.
### Panel 3: J142824+015934
- **Main Plot**:
- **x-axis**: λ_rest (μm) from 10¹ to 10².
- **y-axis**: Flux density (mJy) from 10¹ to 10².
- **Shaded Area**: Confidence interval (gray).
- **Black Line**: Central flux density trend.
- **Error Bars**: Vertical error bars at specific λ_rest values.
- **Text**: `log L_IR[L_☉] = 13.1+0.6−0.6`, `z = 6.07`.
- **Hexbin Plot**:
- **x-axis**: log M_dust (M_☉) from 5 to 100.
- **y-axis**: T_dust (K) from 50 to 100.
- **Color Gradient**: Darker shades indicate higher density.
- **Histograms**:
- **T_dust (K)**: Bins from 50 to 100.
- **log M_dust (M_☉)**: Bins from 5 to 100.
### Panel 4: J0235+0532
- **Main Plot**:
- **x-axis**: λ_rest (μm) from 10¹ to 10².
- **y-axis**: Flux density (mJy) from 10⁻¹ to 10⁰.
- **Shaded Area**: Confidence interval (gray).
- **Black Line**: Central flux density trend.
- **Error Bars**: Vertical error bars at specific λ_rest values.
- **Text**: `log L_IR[L_☉] = 11.9+0.8−0.9`, `z = 5.84`.
- **Hexbin Plot**:
- **x-axis**: log M_dust (M_☉) from 5 to 100.
- **y-axis**: T_dust (K) from 50 to 100.
- **Color Gradient**: Darker shades indicate higher density.
- **Histograms**:
- **T_dust (K)**: Bins from 50 to 100.
- **log M_dust (M_☉)**: Bins from 5 to 100.
### Panel 5: Stack Low-β
- **Main Plot**:
- **x-axis**: λ_rest (μm) from 10¹ to 10².
- **y-axis**: Flux density (mJy) from 10⁻¹ to 10⁰.
- **Shaded Area**: Confidence interval (gray).
- **Black Line**: Central flux density trend.
- **Error Bars**: Vertical error bars at specific λ_rest values.
- **Text**: `log L_IR[L_☉] = 11.4+0.5−0.2`, `z = 6.07`.
- **Hexbin Plot**:
- **x-axis**: log M_dust (M_☉) from 5 to 100.
- **y-axis**: T_dust (K) from 50 to 100.
- **Color Gradient**: Darker shades indicate higher density.
- **Histograms**:
- **T_dust (K)**: Bins from 50 to 100.
- **log M_dust (M_☉)**: Bins from 5 to 100.
---
## Key Observations
1. **Flux Density Trends**:
- All panels show a **peak in flux density** at mid-wavelength (λ_rest ~ 10–100 µm), with a **decline at longer wavelengths**.
- **Error bars** indicate uncertainty in measurements, with some panels showing larger uncertainties (e.g., J022627-045238).
2. **Dust Properties**:
- **Hexbin Plots**: Most panels show a **negative correlation** between T_dust and log M_dust (higher dust mass correlates with lower temperature).
- **Histograms**:
- **T_dust**: Peaks at ~60–80 K (e.g., J200038-021052).
- **log M_dust**: Peaks at ~6–8 M_☉ (e.g., J135348-001026).
3. **Stacked Data**:
- **"Stack high-β"**: Higher log L_IR (12.3) and z = 6.07.
- **"Stack low-β"**: Lower log L_IR (11.4) and z = 6.07.
---
## Legend and Spatial Grounding
- **Legend**: No explicit legend is present in the image.
- **Color Gradient**: Hexbin plots use a **grayscale gradient** (dark to light) to represent density, but no colorbar or legend is provided.
---
## Transcribed Text
- **Labels**:
- "stack high-β" and "stack low-β" (bottom panels).
- Panel identifiers (e.g., J200038-021052, J091436+044231).
- **Axis Titles**:
- x-axis: "λ_rest [μm]" (wavelength).
- y-axis: "Flux density [mJy]" (left column), "T_dust [K]" (hexbin plots).
- **Units**:
- Flux density: mJy.
- Dust temperature: K.
- Dust mass: M_☉ (solar masses).
---
## Conclusion
The image provides a comprehensive view of **infrared flux density**, **dust temperature**, and **dust mass** for multiple astronomical sources. The data suggests a **trade-off between dust mass and temperature**, with higher mass correlating with lower temperatures. The stacked data ("high-β" and "low-β") highlights differences in intrinsic luminosity and redshift.
**Note**: No non-English text is present in the image.
DECODING INTELLIGENCE...