\n
## Line Charts: Model Performance vs. Scale
### Overview
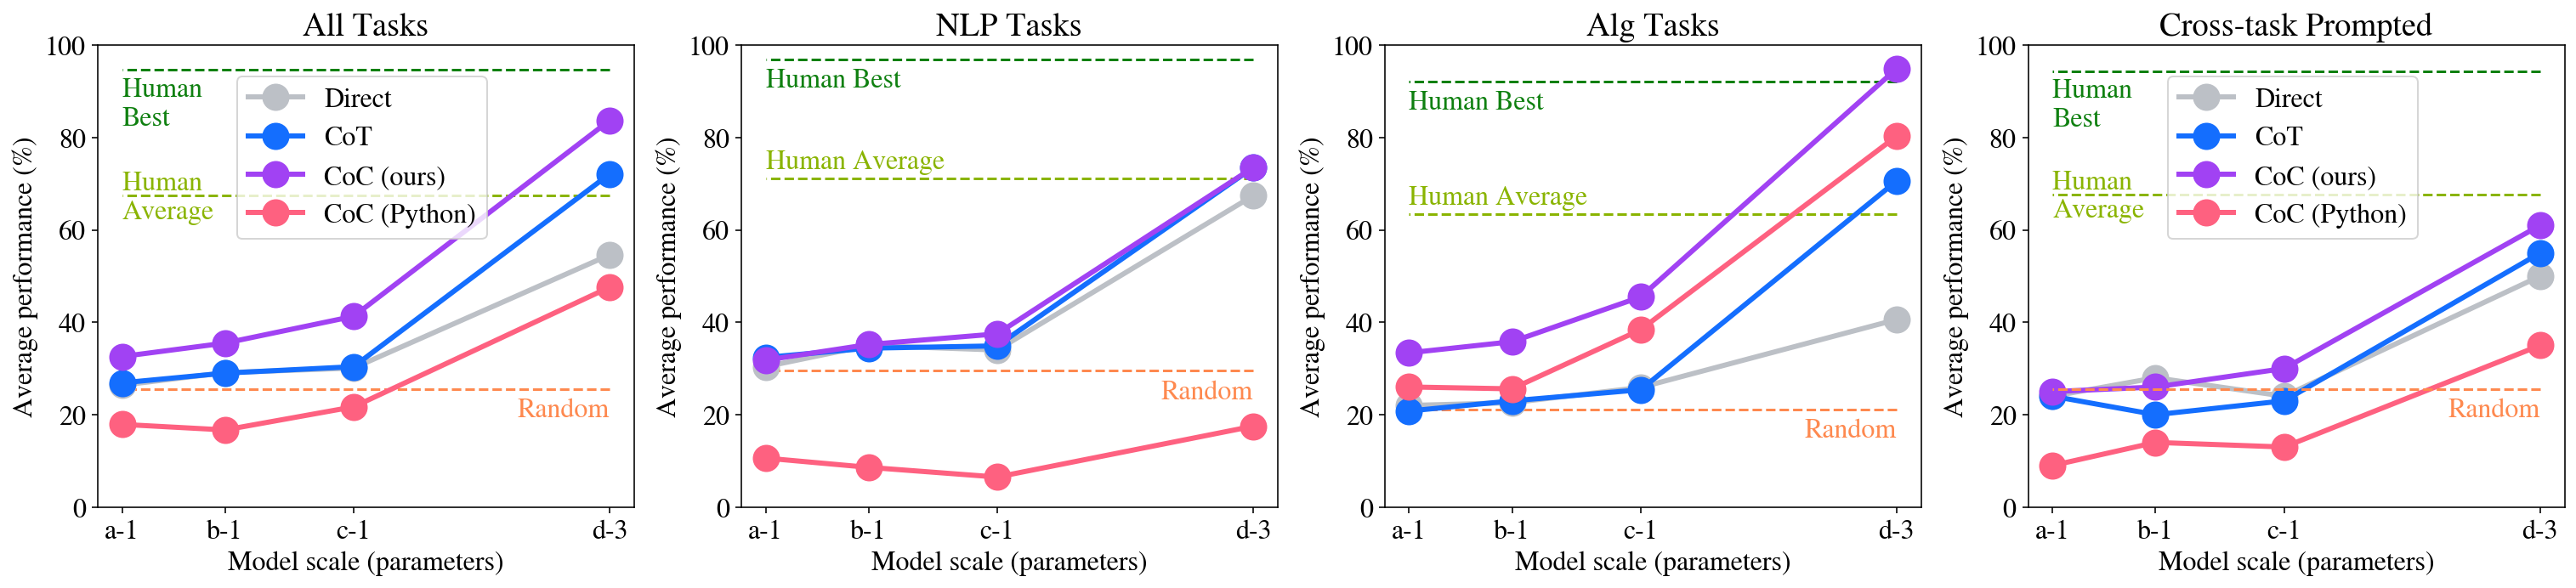
The image presents four line charts comparing the performance of different approaches (Human, Direct, CoT, CoC) across varying model scales (a-1, b-1, c-1, d-3) for different task categories: All Tasks, NLP Tasks, Alg Tasks, and Cross-task Prompted. Performance is measured as Average Performance (%) on the y-axis, while the x-axis represents Model Scale (parameters).
### Components/Axes
* **X-axis:** Model Scale (parameters) with markers: a-1, b-1, c-1, d-3.
* **Y-axis:** Average Performance (%) with a scale from 0 to 100, incrementing by 20.
* **Legend (top-left of each chart):**
* Human (Orange)
* Direct (Blue)
* CoT (Purple)
* CoC (ours) (Green)
* CoC (Python) (Pink)
* **Horizontal dashed lines:**
* Random (approximately at 20%)
* Human Average (approximately at 40% for All Tasks, NLP Tasks, and Cross-task Prompted, and approximately at 60% for Alg Tasks)
* Human Best (approximately at 100%)
### Detailed Analysis or Content Details
**Chart 1: All Tasks**
* **Human:** Performance is relatively stable around 30-40% across all model scales.
* **Direct:** Starts around 25% at a-1, dips slightly to ~20% at b-1, rises to ~30% at c-1, and then increases to ~40% at d-3.
* **CoT:** Starts around 20% at a-1, increases sharply to ~60% at b-1, continues to rise to ~80% at c-1, and reaches approximately 90% at d-3.
* **CoC (ours):** Starts around 20% at a-1, increases to ~40% at b-1, rises to ~60% at c-1, and reaches approximately 70% at d-3.
* **CoC (Python):** Starts around 20% at a-1, increases to ~30% at b-1, rises to ~50% at c-1, and reaches approximately 60% at d-3.
**Chart 2: NLP Tasks**
* **Human:** Performance is relatively stable around 40-50% across all model scales.
* **Direct:** Starts around 20% at a-1, remains around 20-25% at b-1 and c-1, and increases to ~30% at d-3.
* **CoT:** Starts around 20% at a-1, increases sharply to ~60% at b-1, continues to rise to ~80% at c-1, and reaches approximately 90% at d-3.
* **CoC (ours):** Starts around 20% at a-1, increases to ~40% at b-1, rises to ~60% at c-1, and reaches approximately 70% at d-3.
* **CoC (Python):** Starts around 20% at a-1, increases to ~30% at b-1, rises to ~40% at c-1, and reaches approximately 50% at d-3.
**Chart 3: Alg Tasks**
* **Human:** Performance is relatively stable around 60-70% across all model scales.
* **Direct:** Starts around 20% at a-1, remains around 20-25% at b-1 and c-1, and increases to ~30% at d-3.
* **CoT:** Starts around 20% at a-1, increases sharply to ~40% at b-1, continues to rise to ~70% at c-1, and reaches approximately 90% at d-3.
* **CoC (ours):** Starts around 20% at a-1, increases to ~40% at b-1, rises to ~60% at c-1, and reaches approximately 80% at d-3.
* **CoC (Python):** Starts around 20% at a-1, increases to ~30% at b-1, rises to ~40% at c-1, and reaches approximately 50% at d-3.
**Chart 4: Cross-task Prompted**
* **Human:** Performance is relatively stable around 40-50% across all model scales.
* **Direct:** Starts around 20% at a-1, remains around 20-25% at b-1 and c-1, and increases to ~30% at d-3.
* **CoT:** Starts around 20% at a-1, increases sharply to ~60% at b-1, continues to rise to ~80% at c-1, and reaches approximately 90% at d-3.
* **CoC (ours):** Starts around 20% at a-1, increases to ~40% at b-1, rises to ~60% at c-1, and reaches approximately 70% at d-3.
* **CoC (Python):** Starts around 20% at a-1, increases to ~30% at b-1, rises to ~40% at c-1, and reaches approximately 50% at d-3.
### Key Observations
* CoT consistently outperforms all other methods across all task categories and model scales, showing a strong positive correlation between model scale and performance.
* CoC (ours) and CoC (Python) show improvement with increasing model scale, but their performance remains below CoT.
* Direct performance is relatively low and shows minimal improvement with increasing model scale.
* Human performance serves as a baseline, with Human Average and Human Best providing upper and lower bounds for the models.
* The "Random" baseline is consistently below all model performances, indicating that the models are learning something beyond random chance.
### Interpretation
The data demonstrates that Chain-of-Thought (CoT) prompting significantly enhances model performance, particularly as the model scale increases. This suggests that larger models benefit more from the reasoning capabilities enabled by CoT. CoC (ours) and CoC (Python) also show positive scaling, but to a lesser extent than CoT. The consistent underperformance of the "Direct" approach highlights the importance of prompting strategies for eliciting better results from language models. The differences in performance across task categories (NLP, Alg, Cross-task) suggest that the effectiveness of different prompting strategies may vary depending on the nature of the task. The relatively stable human performance provides a benchmark for evaluating the models' progress towards human-level intelligence. The gap between Human Average and Human Best indicates the potential for further improvement in model performance. The consistent performance above the "Random" baseline confirms that the models are learning meaningful patterns from the data.