## Line Graphs: Model Performance Across Task Types
### Overview
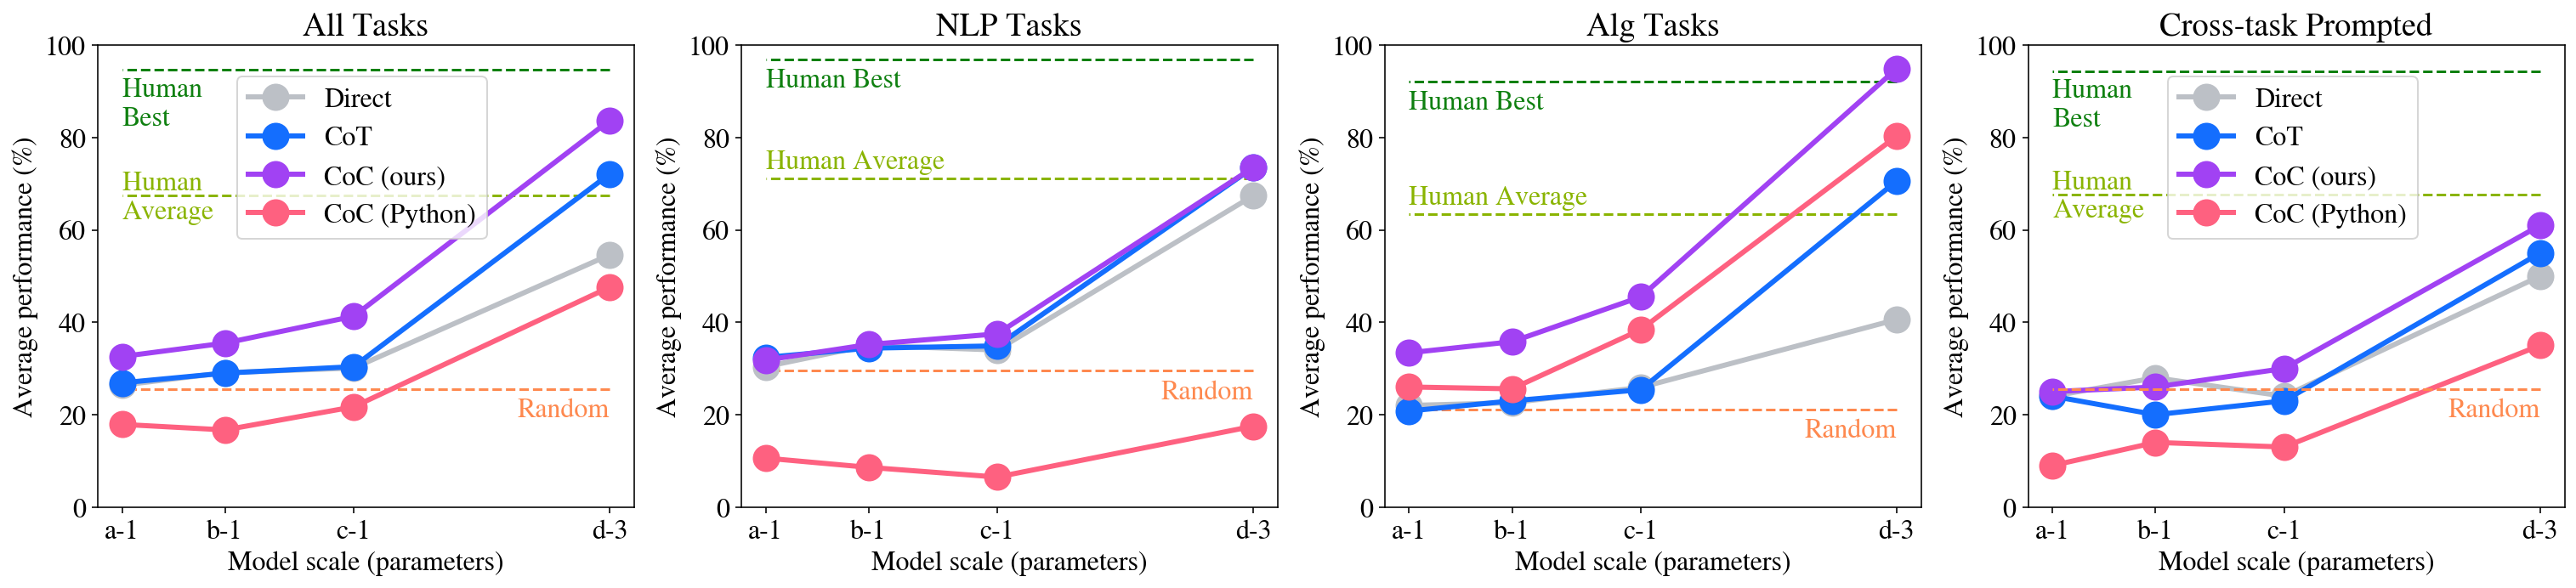
The image contains four line graphs comparing model performance across different task types (All Tasks, NLP Tasks, Alg Tasks, Cross-task Prompted) as model scale increases. Each graph shares consistent axes and legend elements, with performance measured in percentage on the y-axis and model scale (parameters) on the x-axis.
### Components/Axes
- **X-axis**: Model scale (parameters) with categories: a-1, b-1, c-1, d-3
- **Y-axis**: Average performance (%) ranging from 0 to 100
- **Legends**:
- **Direct**: Gray line
- **CoT**: Blue line
- **Co (ours)**: Purple line
- **Co (Python)**: Red line
- **Human Best**: Dashed green line (100%)
- **Human Average**: Dashed yellow line (~70%)
- **Random**: Orange dashed line (~20%)
### Detailed Analysis
#### All Tasks
- **Co (ours)** (purple): Steep upward trend from ~30% (a-1) to ~85% (d-3)
- **Direct** (gray): Gradual increase from ~25% to ~55%
- **CoT** (blue): Moderate rise from ~25% to ~70%
- **Co (Python)** (red): Slow growth from ~15% to ~45%
- **Human Best**: Horizontal dashed green line at 100%
- **Human Average**: Horizontal dashed yellow line at ~70%
- **Random**: Horizontal orange dashed line at ~20%
#### NLP Tasks
- **Co (ours)** (purple): Sharp rise from ~30% to ~75%
- **Direct** (gray): Steady increase from ~30% to ~70%
- **CoT** (blue): Flat at ~35% then jumps to ~70%
- **Co (Python)** (red): Minimal growth from ~5% to ~15%
- **Human Best**: 100% dashed green line
- **Human Average**: ~70% dashed yellow line
- **Random**: ~20% orange dashed line
#### Alg Tasks
- **Co (ours)** (purple): Steep ascent from ~30% to ~95%
- **Direct** (gray): Gradual rise from ~25% to ~40%
- **CoT** (blue): Moderate increase from ~20% to ~70%
- **Co (Python)** (red): Strong upward trend from ~25% to ~80%
- **Human Best**: 100% dashed green line
- **Human Average**: ~60% dashed yellow line
- **Random**: ~20% orange dashed line
#### Cross-task Prompted
- **Co (ours)** (purple): Rapid growth from ~25% to ~60%
- **Direct** (gray): Steady climb from ~25% to ~50%
- **CoT** (blue): Moderate rise from ~20% to ~55%
- **Co (Python)** (red): Slow increase from ~10% to ~35%
- **Human Best**: 100% dashed green line
- **Human Average**: ~50% dashed yellow line
- **Random**: ~20% orange dashed line
### Key Observations
1. **Co (ours)** consistently outperforms other methods across all task types, especially at larger model scales (d-3)
2. **Human Best** remains an unattainable upper bound (100%) in all cases
3. **Co (Python)** shows variable performance but generally lags behind Co (ours)
4. **Random** baseline remains constant at ~20% across all tasks
5. **Direct** method shows moderate improvement but underperforms Co approaches
### Interpretation
The data demonstrates that Co (ours) methodology achieves the highest performance gains as model scale increases, particularly in algorithmic and cross-task scenarios. This suggests that the Co (ours) approach effectively leverages larger models for complex reasoning tasks. The persistent gap between model performance and Human Best indicates significant room for improvement in AI reasoning capabilities. The Random baseline's consistency highlights the importance of structured reasoning methods over chance. Notably, Co (Python) underperforms in NLP tasks despite similar parameter scales, suggesting task-specific limitations in its implementation.