## Multimodal Data Embedding Diagram
### Overview
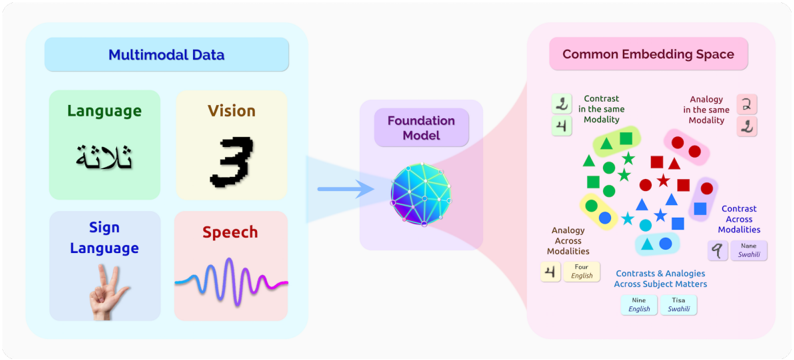
The image is a diagram illustrating how multimodal data is processed and embedded into a common space using a foundation model. It shows the flow of information from various data modalities (language, vision, sign language, speech) through a model, resulting in a common embedding space where relationships and contrasts between modalities can be analyzed.
### Components/Axes
* **Header (Top-Left):** "Multimodal Data" in a light blue box.
* Sub-categories:
* "Language" in a light green box.
* "Vision" in a light yellow box.
* "Sign Language" in a light blue box.
* "Speech" in a light pink box.
* **Center:** "Foundation Model" in a light purple box.
* **Header (Top-Right):** "Common Embedding Space" in a light pink box.
* **Data Modalities:**
* **Language:** Contains the Arabic word "ثلاثة" (Thalatha). Translation: "Three".
* **Vision:** Contains the number "3" in a pixelated font.
* **Sign Language:** Shows a hand making the number "3" in American Sign Language.
* **Speech:** A waveform representing a speech signal.
* **Foundation Model:** A 3D sphere with a blue and purple gradient, representing the model processing the input data.
* **Common Embedding Space:** A scatter plot-like representation of data points in a 2D space, with different shapes and colors representing different modalities and relationships.
* **Shapes:** Circle, Square, Triangle, Star, Rectangle.
* **Colors:** Green, Red, Blue, Yellow.
* **Relationships in Embedding Space:**
* "Contrast in the same Modality": Example shows the numbers "2" and "4".
* "Analogy in the same Modality": Example shows the numbers "2" and "2".
* "Analogy Across Modalities": Example shows the number "4" and the word "Four English".
* "Contrast Across Modalities": Example shows the number "9" and the word "Nane Swahili".
* "Contrasts & Analogies Across Subject Matters": Example shows the words "Nine English" and "Tisa Swahili".
### Detailed Analysis or Content Details
* **Multimodal Data:** The diagram starts with four different data modalities: Language, Vision, Sign Language, and Speech. Each modality is represented by a specific example.
* **Language:** The Arabic word "ثلاثة" (Thalatha) is displayed, which translates to "three" in English.
* **Vision:** The digit "3" is shown in a pixelated format.
* **Sign Language:** A hand gesture representing the number "3" in sign language is depicted.
* **Speech:** A waveform illustrates a speech signal.
* **Foundation Model:** The data from these modalities is fed into a "Foundation Model," represented by a sphere with a blue and purple gradient. This model processes the data and transforms it into a common embedding space.
* **Common Embedding Space:** The output of the Foundation Model is a "Common Embedding Space," where data points from different modalities are represented as shapes and colors. The spatial arrangement of these points reflects the relationships and contrasts between the modalities.
* **Contrast in the same Modality:** This section shows an example of contrasting numbers "2" and "4".
* **Analogy in the same Modality:** This section shows an example of analogous numbers "2" and "2".
* **Analogy Across Modalities:** This section shows an example of analogy between the number "4" and the word "Four English".
* **Contrast Across Modalities:** This section shows an example of contrast between the number "9" and the word "Nane Swahili".
* **Contrasts & Analogies Across Subject Matters:** This section shows an example of contrasts and analogies between the words "Nine English" and "Tisa Swahili".
### Key Observations
* The diagram illustrates the process of converting data from different modalities into a unified representation.
* The Common Embedding Space allows for the comparison and analysis of relationships between different modalities.
* The examples provided highlight how the model can identify contrasts and analogies within and across modalities.
* The use of shapes and colors in the Common Embedding Space visually represents the different modalities and their relationships.
### Interpretation
The diagram demonstrates the concept of multimodal data embedding, where information from various sources (language, vision, sign language, speech) is processed by a foundation model to create a common representation. This common embedding space enables the identification of relationships, analogies, and contrasts between different modalities. The diagram suggests that the foundation model can effectively integrate and analyze data from diverse sources, leading to a deeper understanding of the underlying information. The examples provided illustrate the model's ability to recognize semantic relationships between numbers and words in different languages, highlighting its potential for cross-modal understanding and reasoning.