\n
## Diagram: Multimodal Data to Common Embedding Space
### Overview
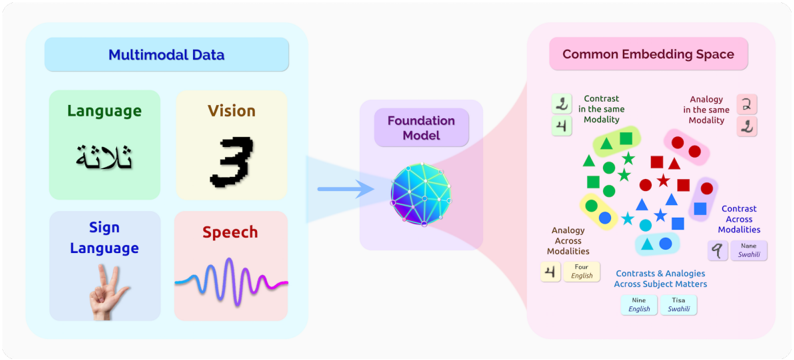
This diagram illustrates the process of converting multimodal data (Language, Vision, Sign Language, and Speech) into a common embedding space using a Foundation Model. The diagram shows the input modalities, the central Foundation Model, and the resulting representation in the Common Embedding Space, highlighting concepts of contrast and analogy both within and across modalities.
### Components/Axes
The diagram is segmented into three main sections:
1. **Multimodal Data (Left):** Contains four input modalities: Language, Vision, Sign Language, and Speech.
2. **Foundation Model (Center):** A central processing unit represented as a complex, colorful network.
3. **Common Embedding Space (Right):** Displays data points representing the output of the Foundation Model, categorized by contrast and analogy.
The diagram includes the following textual labels:
* "Multimodal Data"
* "Language"
* "Vision"
* "Sign Language"
* "Speech"
* "Foundation Model"
* "Common Embedding Space"
* "Contrast in the same Modality"
* "Analogy in the same Modality"
* "Analogy Across Modalities"
* "Contrast Across Modalities"
* "Four English"
* "Nine English"
* "Tisa Swahili"
* "Nane Swahili"
* Arabic text: "ثلاثة" (Translation: "Three")
### Detailed Analysis or Content Details
The diagram depicts a flow from left to right.
**Multimodal Data:**
* **Language:** Displays the Arabic word "ثلاثة" (Translation: "Three").
* **Vision:** Shows the numeral "3".
* **Sign Language:** Depicts a hand gesture.
* **Speech:** Represents a waveform.
**Foundation Model:**
* The Foundation Model is visually represented as a complex network of interconnected nodes, colored in shades of blue, purple, and white. It acts as a central processing unit, receiving input from all four modalities.
**Common Embedding Space:**
* This section displays data points clustered based on relationships.
* **Contrast in the same Modality:** Contains green triangles, red squares, and blue stars.
* **Analogy in the same Modality:** Contains red circles and dark red circles.
* **Analogy Across Modalities:** Contains blue squares and light blue squares.
* **Contrast Across Modalities:** Contains blue triangles and purple triangles.
* Below these clusters, the diagram states: "Contrasts & Analogies Across Subject Matters".
* Further below, it states: "Four English" and "Nine English" alongside "Tisa Swahili" and "Nane Swahili".
### Key Observations
* The diagram emphasizes the conversion of diverse data types into a unified representation.
* The use of color-coding and shapes in the Common Embedding Space suggests different categories of relationships (contrast vs. analogy, within vs. across modalities).
* The inclusion of both English and Swahili text indicates a focus on multilingual capabilities.
* The Arabic word "ثلاثة" and the numeral "3" are presented as examples of equivalent concepts across modalities.
### Interpretation
The diagram illustrates the core concept of multimodal learning, where a Foundation Model is used to create a shared embedding space for different data modalities. This allows the model to understand relationships between concepts expressed in different forms (text, images, sounds, gestures). The distinction between "contrast" and "analogy" highlights the model's ability to identify both differences and similarities. The inclusion of multiple languages suggests the model's potential for cross-lingual understanding. The numerical labels ("Four English", "Nine English", "Tisa Swahili", "Nane Swahili") likely represent the number of examples or data points used to demonstrate these relationships within the embedding space. The diagram suggests that the Foundation Model is capable of capturing semantic meaning across modalities and languages, enabling more sophisticated AI applications. The diagram is conceptual and does not provide specific numerical data or performance metrics. It is a high-level illustration of a system architecture.