\n
## Line Chart: Proportion of Flips vs. Iterations (Qwen2.5-14B)
### Overview
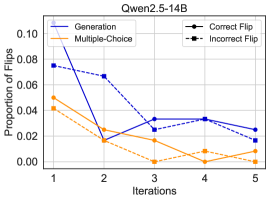
This line chart depicts the proportion of flips observed across different iterations for various methods: Generation, Multiple-Choice, Correct Flip, and Incorrect Flip. The chart aims to illustrate how the frequency of flips changes as the process iterates. The title "Qwen2.5-14B" suggests this data relates to a model or experiment using that specific configuration.
### Components/Axes
* **X-axis:** Iterations (labeled 1 to 5).
* **Y-axis:** Proportion of Flips (scale from 0.00 to 0.10, increments of 0.02).
* **Legend:** Located in the top-right corner.
* Generation (Blue solid line)
* Multiple-Choice (Orange solid line)
* Correct Flip (Black dashed line)
* Incorrect Flip (Black dotted line)
* **Gridlines:** Present to aid in reading values.
### Detailed Analysis
Let's analyze each line individually, noting trends and approximate data points.
* **Generation (Blue):** This line starts at approximately 0.085 at Iteration 1, sharply decreases to around 0.06 at Iteration 2, continues to decrease to approximately 0.02 at Iteration 3, slightly increases to around 0.03 at Iteration 4, and then decreases again to approximately 0.025 at Iteration 5. The overall trend is decreasing, but with a slight fluctuation around Iteration 4.
* **Multiple-Choice (Orange):** This line begins at approximately 0.05 at Iteration 1, drops to around 0.02 at Iteration 2, continues to decrease to approximately 0.01 at Iteration 3, dips to around 0.005 at Iteration 4, and then slightly increases to approximately 0.01 at Iteration 5. This line shows a consistent downward trend.
* **Correct Flip (Black dashed):** This line starts at approximately 0.075 at Iteration 1, decreases to around 0.04 at Iteration 2, continues to decrease to approximately 0.02 at Iteration 3, remains relatively stable at around 0.02 at Iteration 4, and then decreases slightly to approximately 0.015 at Iteration 5.
* **Incorrect Flip (Black dotted):** This line begins at approximately 0.04 at Iteration 1, decreases to around 0.02 at Iteration 2, continues to decrease to approximately 0.01 at Iteration 3, remains relatively stable at around 0.01 at Iteration 4, and then decreases slightly to approximately 0.005 at Iteration 5.
### Key Observations
* All four lines demonstrate a decreasing trend in the proportion of flips as the number of iterations increases.
* The "Generation" method consistently exhibits the highest proportion of flips throughout all iterations.
* The "Incorrect Flip" method consistently exhibits the lowest proportion of flips throughout all iterations.
* The "Multiple-Choice" method shows the most consistent and rapid decline in flips.
* The "Correct Flip" and "Incorrect Flip" lines converge towards the end of the iterations.
### Interpretation
The data suggests that as the process iterates, the frequency of "flips" (presumably errors or changes in state) decreases for all methods tested. The "Generation" method, while starting with the highest flip rate, still shows a reduction over iterations. The rapid decline in flips for the "Multiple-Choice" method could indicate its efficiency in converging towards a stable state. The convergence of "Correct Flip" and "Incorrect Flip" towards the end suggests that distinguishing between these types of flips becomes more difficult as the iterations progress, potentially indicating a diminishing return in identifying the specific nature of the flips. The overall trend implies that the iterative process is effective in reducing instability or errors within the Qwen2.5-14B model or system being evaluated. The "flips" could represent changes in model parameters, incorrect predictions, or other forms of deviation from the desired outcome. Further investigation would be needed to understand the specific meaning of a "flip" in the context of this experiment.