## Line Graph: Qwen2.5-14B Performance Over Iterations
### Overview
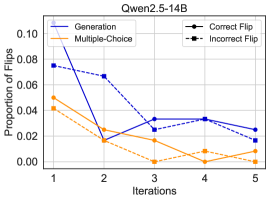
The graph illustrates the proportion of "flips" (changes in model outputs) across five iterations for four distinct strategies: Generation, Multiple-Choice, Correct Flip, and Incorrect Flip. The y-axis represents the proportion of flips (0.00–0.10), and the x-axis represents iterations (1–5). The legend is positioned at the top-right corner.
### Components/Axes
- **X-axis (Iterations)**: Labeled "Iterations" with markers at 1, 2, 3, 4, 5.
- **Y-axis (Proportion of Flips)**: Labeled "Proportion of Flips" with increments of 0.02.
- **Legend**:
- Solid blue line: Generation
- Dashed orange line: Multiple-Choice
- Solid black line: Correct Flip
- Dashed black line: Incorrect Flip
### Detailed Analysis
1. **Generation (Solid Blue Line)**:
- Starts at ~0.08 (iteration 1), drops sharply to ~0.02 (iteration 2), then stabilizes around ~0.03–0.04 (iterations 3–5).
- **Trend**: Steep initial decline followed by stabilization.
2. **Multiple-Choice (Dashed Orange Line)**:
- Begins at ~0.04 (iteration 1), decreases to ~0.02 (iteration 2), then plummets to ~0.00 (iteration 3), remaining near 0.00 for iterations 4–5.
- **Trend**: Rapid decline after iteration 2, becoming negligible by iteration 3.
3. **Correct Flip (Solid Black Line)**:
- Starts at ~0.02 (iteration 1), peaks at ~0.06 (iteration 2), then declines to ~0.01 (iteration 5).
- **Trend**: Early peak followed by a gradual decline.
4. **Incorrect Flip (Dashed Black Line)**:
- Begins at ~0.06 (iteration 1), drops to ~0.01 (iteration 2), then stabilizes near 0.00–0.01 (iterations 3–5).
- **Trend**: Sharp initial drop, followed by minimal fluctuation.
### Key Observations
- **Generation** and **Incorrect Flip** exhibit the most significant early declines, suggesting reduced reliance on these strategies as iterations progress.
- **Multiple-Choice** becomes nearly irrelevant after iteration 3, dropping to 0.00.
- **Correct Flip** peaks at iteration 2 (~0.06), indicating a temporary increase in accurate adjustments before stabilizing.
- All lines converge toward lower values by iteration 5, implying improved model consistency over time.
### Interpretation
The data suggests that the Qwen2.5-14B model refines its decision-making process across iterations. The steep decline in **Generation** and **Incorrect Flip** indicates reduced dependency on error-prone or non-deterministic outputs. The near-elimination of **Multiple-Choice** flips implies the model moves away from relying on probabilistic or heuristic-based reasoning. The early peak in **Correct Flip** may reflect initial adjustments to align outputs with expected patterns, followed by stabilization as the model optimizes further. Overall, the trends highlight iterative improvements in output reliability, with later iterations showing fewer deviations (flips) across all strategies.