\n
## Line Charts: Performance Comparison of Rendering Techniques
### Overview
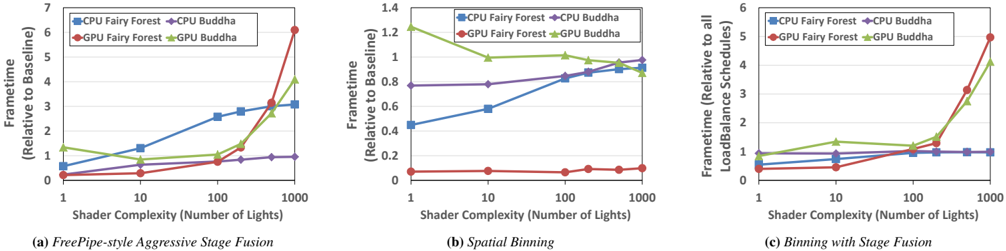
The image presents three line charts comparing the performance of different rendering techniques (CPU Fairy Forest, CPU Buddha, GPU Fairy Forest, GPU Buddha) across varying levels of shader complexity, measured by the number of lights. Each chart focuses on a different optimization strategy: (a) FreePipe-style Aggressive Stage Fusion, (b) Spatial Binning, and (c) Binning with Stage Fusion. The performance metric varies across the charts: Frametime (relative to baseline) for (a) and (b), and LoadBalance (relative to all LoadBalance schedules) for (c).
### Components/Axes
Each chart shares the following components:
* **X-axis:** Shader Complexity (Number of Lights) - Scale: 1, 10, 100, 1000.
* **Y-axis:** Varies per chart.
* (a): Frametime (Relative to Baseline) - Scale: 0 to 7, increments of 1.
* (b): Frametime (Relative to Baseline) - Scale: 0 to 1.4, increments of 0.2.
* (c): LoadBalance (Relative to all LoadBalance schedules) - Scale: 0 to 6, increments of 1.
* **Legend:** Located at the top-right of each chart.
* CPU Fairy Forest (Blue Line)
* CPU Buddha (Green Line)
* GPU Fairy Forest (Red Line)
* GPU Buddha (Yellow Line)
* **Chart Titles:** Located below the x-axis.
* (a): FreePipe-style Aggressive Stage Fusion
* (b): Spatial Binning
* (c): Binning with Stage Fusion
### Detailed Analysis or Content Details
**Chart (a): FreePipe-style Aggressive Stage Fusion**
* **CPU Fairy Forest (Blue):** Starts at approximately 0.1, increases steadily to around 0.6 at 100 lights, and then jumps sharply to approximately 2.5 at 1000 lights.
* **CPU Buddha (Green):** Starts at approximately 0.2, increases to around 0.8 at 100 lights, and then rises sharply to approximately 6.5 at 1000 lights.
* **GPU Fairy Forest (Red):** Remains relatively flat around 0.1-0.2 across all shader complexities.
* **GPU Buddha (Yellow):** Starts at approximately 0.1, increases to around 0.3 at 100 lights, and then rises to approximately 1.5 at 1000 lights.
**Chart (b): Spatial Binning**
* **CPU Fairy Forest (Blue):** Starts at approximately 0.8, decreases slightly to around 0.7 at 10 lights, and then remains relatively stable around 0.8-0.9 up to 1000 lights.
* **CPU Buddha (Green):** Starts at approximately 0.9, decreases to around 0.7 at 10 lights, and then increases to approximately 1.1 at 1000 lights.
* **GPU Fairy Forest (Red):** Remains consistently low, around 0.1-0.2 across all shader complexities.
* **GPU Buddha (Yellow):** Starts at approximately 0.6, decreases to around 0.4 at 10 lights, and then remains relatively stable around 0.5-0.6 up to 1000 lights.
**Chart (c): Binning with Stage Fusion**
* **CPU Fairy Forest (Blue):** Remains relatively flat around 0.8-1.0 across all shader complexities.
* **CPU Buddha (Green):** Starts at approximately 0.9, decreases to around 0.7 at 10 lights, and then increases to approximately 1.5 at 1000 lights.
* **GPU Fairy Forest (Red):** Starts at approximately 0.2, decreases to around 0.1 at 10 lights, and then remains relatively stable around 0.1-0.2 up to 1000 lights.
* **GPU Buddha (Yellow):** Starts at approximately 1.0, decreases to around 0.8 at 10 lights, and then rises sharply to approximately 5.5 at 1000 lights.
### Key Observations
* **GPU consistently outperforms CPU:** Across all three charts, the GPU-based rendering techniques (Fairy Forest and Buddha) generally exhibit lower frametimes and/or better load balance compared to their CPU counterparts, especially at higher shader complexities.
* **Shader complexity impact:** In chart (a) and (c), both CPU-based techniques show a significant performance degradation (increased frametime/load balance) as shader complexity increases.
* **Spatial Binning (b) stabilizes CPU performance:** Chart (b) demonstrates that Spatial Binning helps to stabilize the performance of CPU-based techniques, preventing the sharp increase in frametime observed in chart (a) and (c).
* **GPU Buddha outlier in (c):** GPU Buddha shows a dramatic increase in LoadBalance at 1000 lights in chart (c), suggesting a potential bottleneck or inefficiency at high shader complexity.
### Interpretation
These charts compare the scalability of different rendering techniques under increasing shader complexity. The consistent outperformance of GPU-based methods highlights the benefits of GPU acceleration for this workload. The effectiveness of Spatial Binning in mitigating performance degradation on the CPU suggests that this optimization technique can improve scalability. The outlier behavior of GPU Buddha in chart (c) warrants further investigation to identify the root cause of the performance bottleneck at high shader complexity.
The data suggests that the choice of rendering technique and optimization strategy significantly impacts performance, and that careful consideration must be given to the target hardware and expected shader complexity. The FreePipe-style Aggressive Stage Fusion appears to be the least effective optimization for CPU rendering, while Spatial Binning offers a substantial improvement. Binning with Stage Fusion provides a good balance for GPU rendering, but the outlier behavior of GPU Buddha at high complexity needs to be addressed.