## Line Charts: Performance Comparison of Three Rendering Techniques
### Overview
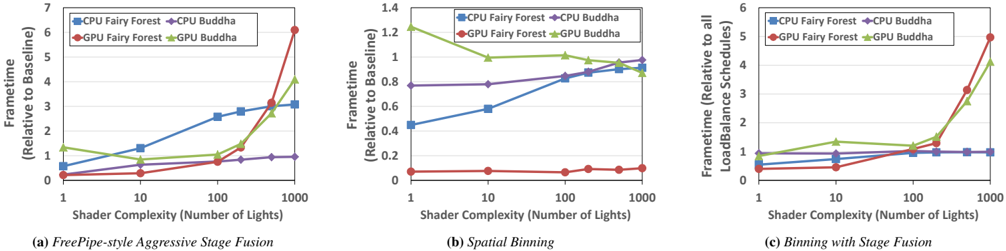
The image displays three line charts arranged horizontally, comparing the performance (framerate relative to a baseline) of two 3D models ("Fairy Forest" and "Buddha") rendered on CPU and GPU across three different rendering optimization techniques. The charts plot performance against increasing shader complexity (number of lights).
### Components/Axes
* **Common X-Axis (All Charts):** "Shader Complexity (Number of Lights)". It is a logarithmic scale with major tick marks at 1, 10, 100, and 1000.
* **Common Legend (All Charts):** Located in the top-left corner of each chart.
* Blue Square Line: `CPU Fairy Forest`
* Red Circle Line: `GPU Fairy Forest`
* Purple Diamond Line: `CPU Buddha`
* Green Triangle Line: `GPU Buddha`
* **Chart-Specific Y-Axes:**
* **Chart (a):** "Frametime (Relative to Baseline)". Scale ranges from 0 to 7.
* **Chart (b):** "Frametime (Relative to Baseline)". Scale ranges from 0 to 1.4.
* **Chart (c):** "Frametime (Relative to all LoadBalance Schedules)". Scale ranges from 0 to 6.
### Detailed Analysis
#### Chart (a): FreePipe-style Aggressive Stage Fusion
* **Trend Verification:**
* `CPU Fairy Forest` (Blue): Slopes steadily upward.
* `GPU Fairy Forest` (Red): Slopes gently upward until 100 lights, then spikes sharply upward.
* `CPU Buddha` (Purple): Remains nearly flat, with a very slight upward trend.
* `GPU Buddha` (Green): Slopes gently upward until 100 lights, then increases more sharply.
* **Data Points (Approximate):**
* **At 1 Light:** CPU Fairy Forest ~0.5, GPU Fairy Forest ~0.2, CPU Buddha ~0.2, GPU Buddha ~1.3.
* **At 10 Lights:** CPU Fairy Forest ~1.3, GPU Fairy Forest ~0.3, CPU Buddha ~0.4, GPU Buddha ~0.7.
* **At 100 Lights:** CPU Fairy Forest ~2.6, GPU Fairy Forest ~0.7, CPU Buddha ~0.8, GPU Buddha ~1.0.
* **At 1000 Lights:** CPU Fairy Forest ~3.0, GPU Fairy Forest ~6.0, CPU Buddha ~0.9, GPU Buddha ~4.0.
#### Chart (b): Spatial Binning
* **Trend Verification:**
* `CPU Fairy Forest` (Blue): Slopes steadily upward.
* `GPU Fairy Forest` (Red): Remains very low and nearly flat.
* `CPU Buddha` (Purple): Remains nearly flat.
* `GPU Buddha` (Green): Slopes gently downward.
* **Data Points (Approximate):**
* **At 1 Light:** CPU Fairy Forest ~0.45, GPU Fairy Forest ~0.05, CPU Buddha ~0.8, GPU Buddha ~1.25.
* **At 10 Lights:** CPU Fairy Forest ~0.6, GPU Fairy Forest ~0.05, CPU Buddha ~0.8, GPU Buddha ~1.0.
* **At 100 Lights:** CPU Fairy Forest ~0.85, GPU Fairy Forest ~0.05, CPU Buddha ~0.85, GPU Buddha ~1.0.
* **At 1000 Lights:** CPU Fairy Forest ~1.0, GPU Fairy Forest ~0.1, CPU Buddha ~1.0, GPU Buddha ~0.9.
#### Chart (c): Binning with Stage Fusion
* **Trend Verification:**
* `CPU Fairy Forest` (Blue): Slopes gently upward.
* `GPU Fairy Forest` (Red): Slopes gently upward until 100 lights, then spikes sharply upward.
* `CPU Buddha` (Purple): Remains nearly flat.
* `GPU Buddha` (Green): Slopes gently upward until 100 lights, then increases more sharply.
* **Data Points (Approximate):**
* **At 1 Light:** CPU Fairy Forest ~0.6, GPU Fairy Forest ~0.5, CPU Buddha ~0.8, GPU Buddha ~0.9.
* **At 10 Lights:** CPU Fairy Forest ~0.7, GPU Fairy Forest ~0.6, CPU Buddha ~0.9, GPU Buddha ~1.3.
* **At 100 Lights:** CPU Fairy Forest ~0.9, GPU Fairy Forest ~1.1, CPU Buddha ~1.0, GPU Buddha ~1.1.
* **At 1000 Lights:** CPU Fairy Forest ~1.0, GPU Fairy Forest ~5.0, CPU Buddha ~1.0, GPU Buddha ~4.0.
### Key Observations
1. **Performance Cliff for GPU:** In techniques (a) and (c), the GPU performance for both models degrades severely (framerate spikes) when shader complexity reaches 1000 lights. This cliff is absent in technique (b).
2. **CPU Stability:** CPU performance for the "Buddha" model is remarkably stable across all techniques and complexities. CPU performance for "Fairy Forest" degrades linearly with complexity in all cases.
3. **Technique (b) Anomaly:** Spatial Binning (b) shows a unique trend where GPU performance for "Buddha" actually *improves* slightly as complexity increases, and GPU performance for "Fairy Forest" remains excellent and flat.
4. **Model Sensitivity:** The "Fairy Forest" model generally shows greater performance sensitivity (steeper slopes) to increased complexity than the "Buddha" model, especially on the GPU.
### Interpretation
The data demonstrates a critical performance trade-off in rendering pipeline design. **FreePipe-style Aggressive Stage Fusion (a)** and **Binning with Stage Fusion (c)** offer good performance at low-to-moderate light counts but suffer from a catastrophic performance breakdown at very high complexity (1000 lights), particularly on the GPU. This suggests these methods may have scalability issues or encounter a resource bottleneck (e.g., register pressure, memory bandwidth) under extreme load.
In contrast, **Spatial Binning (b)** exhibits excellent and stable scalability. It maintains low frametimes for GPU workloads even at 1000 lights, indicating it effectively manages the increased computational load. The slight performance *improvement* for the GPU Buddha model is anomalous and could suggest that the binning strategy becomes more efficient with certain scene characteristics at higher densities, or it may be within measurement noise.
The consistent linear degradation of CPU Fairy Forest performance across all techniques implies that CPU-bound work for that model scales directly with light count, unaffected by the GPU-focused optimizations. The stability of CPU Buddha suggests its workload is less dependent on the number of lights. This analysis highlights that the choice of rendering technique must be guided by the expected scene complexity (light count) and the target hardware's performance profile.