## Line Graphs: Rendering Technique Performance vs Shader Complexity
### Overview
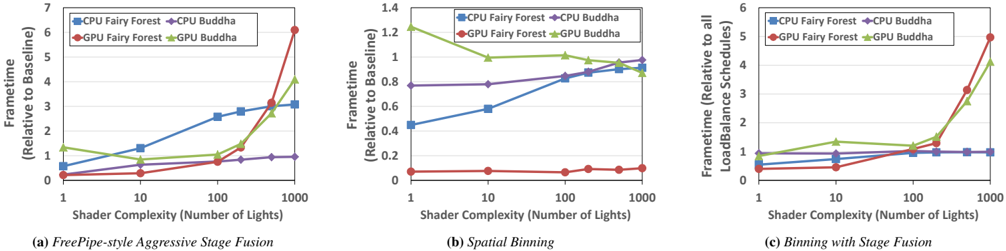
Three line graphs compare the performance of CPU/GPU rendering techniques (Fairy Forest and Buddha) across increasing shader complexity (number of lights). Each chart represents a different optimization strategy: (a) FreePipe-style Aggressive Stage Fusion, (b) Spatial Binning, and (c) Binning with Stage Fusion. Performance is measured as "Frametime Relative to Baseline" on the y-axis, with shader complexity (1–1000 lights) on the x-axis.
---
### Components/Axes
1. **X-Axis**: Shader Complexity (Number of Lights)
- Logarithmic scale: 1, 10, 100, 1000
2. **Y-Axis**: Frametime Relative to Baseline
- Varies by chart:
- (a) 0–7
- (b) 0–1.4
- (c) 0–6
3. **Legends**:
- **CPU Fairy Forest** (blue squares)
- **CPU Buddha** (purple diamonds)
- **GPU Fairy Forest** (red circles)
- **GPU Buddha** (green triangles)
- Positioned in the top-left corner of each chart.
---
### Detailed Analysis
#### Chart (a): FreePipe-style Aggressive Stage Fusion
- **Trends**:
- **CPU Buddha** (purple): Gradual increase from ~0.2 to ~1.0.
- **CPU Fairy Forest** (blue): Steeper rise from ~0.5 to ~3.0.
- **GPU Buddha** (green): Starts at ~1.2, dips to ~0.8 at 10 lights, then rises sharply to ~4.0 at 1000 lights.
- **GPU Fairy Forest** (red): Sharp increase from ~0.1 to ~6.5 at 1000 lights.
- **Key Data Points**:
- At 1 light: All methods ~0.1–0.2.
- At 100 lights: GPU Buddha ~1.5, GPU Fairy Forest ~2.0.
- At 1000 lights: GPU Fairy Forest peaks at ~6.5 (highest), GPU Buddha ~4.0.
#### Chart (b): Spatial Binning
- **Trends**:
- **CPU Buddha** (purple): Flat (~0.8).
- **CPU Fairy Forest** (blue): Moderate rise from ~0.4 to ~0.9.
- **GPU Buddha** (green): Slight decline from ~1.2 to ~0.9.
- **GPU Fairy Forest** (red): Stable (~0.1–0.2).
- **Key Data Points**:
- At 1 light: GPU Buddha ~1.2 (highest).
- At 1000 lights: CPU Buddha ~0.9, GPU Buddha ~0.9.
#### Chart (c): Binning with Stage Fusion
- **Trends**:
- **CPU Buddha** (purple): Flat (~1.0).
- **CPU Fairy Forest** (blue): Slight rise from ~0.8 to ~1.0.
- **GPU Buddha** (green): Sharp increase from ~1.0 to ~5.0 at 1000 lights.
- **GPU Fairy Forest** (red): Moderate rise from ~0.3 to ~5.0 at 1000 lights.
- **Key Data Points**:
- At 1 light: All methods ~0.3–1.0.
- At 1000 lights: GPU Buddha ~5.0 (highest), GPU Fairy Forest ~5.0.
---
### Key Observations
1. **GPU Performance Degradation**:
- GPU Buddha (green) shows significant performance drops in (a) and (c) as shader complexity increases, suggesting inefficiency in handling complex lighting.
2. **CPU vs GPU**:
- CPU methods (blue/purple) generally outperform GPUs in (b) but lag behind in (a) and (c).
3. **Fairy Forest vs Buddha**:
- GPU Fairy Forest (red) consistently outperforms GPU Buddha (green) in (a) and (c), but underperforms in (b).
4. **Spatial Binning Stability**:
- Chart (b) shows the least performance variation across methods, with GPU Buddha maintaining near-baseline performance.
---
### Interpretation
The data highlights trade-offs between rendering techniques and hardware:
- **FreePipe-style Fusion (a)** and **Binning with Stage Fusion (c)** amplify GPU inefficiencies at high complexity, with GPU Buddha suffering the most.
- **Spatial Binning (b)** mitigates performance degradation, making GPU Buddha competitive.
- CPU methods (Fairy Forest/Buddha) scale better in (b) but struggle with aggressive optimizations in (a) and (c).
- The sharp spikes in GPU performance (e.g., GPU Fairy Forest in (a)) suggest potential bottlenecks in shader compilation or memory access at extreme complexity.
This analysis underscores the importance of optimization strategy (e.g., spatial binning) in balancing GPU/CPU performance across varying workloads.