## Line Graphs: Throughput vs. Request Rate for Caching Strategies
### Overview
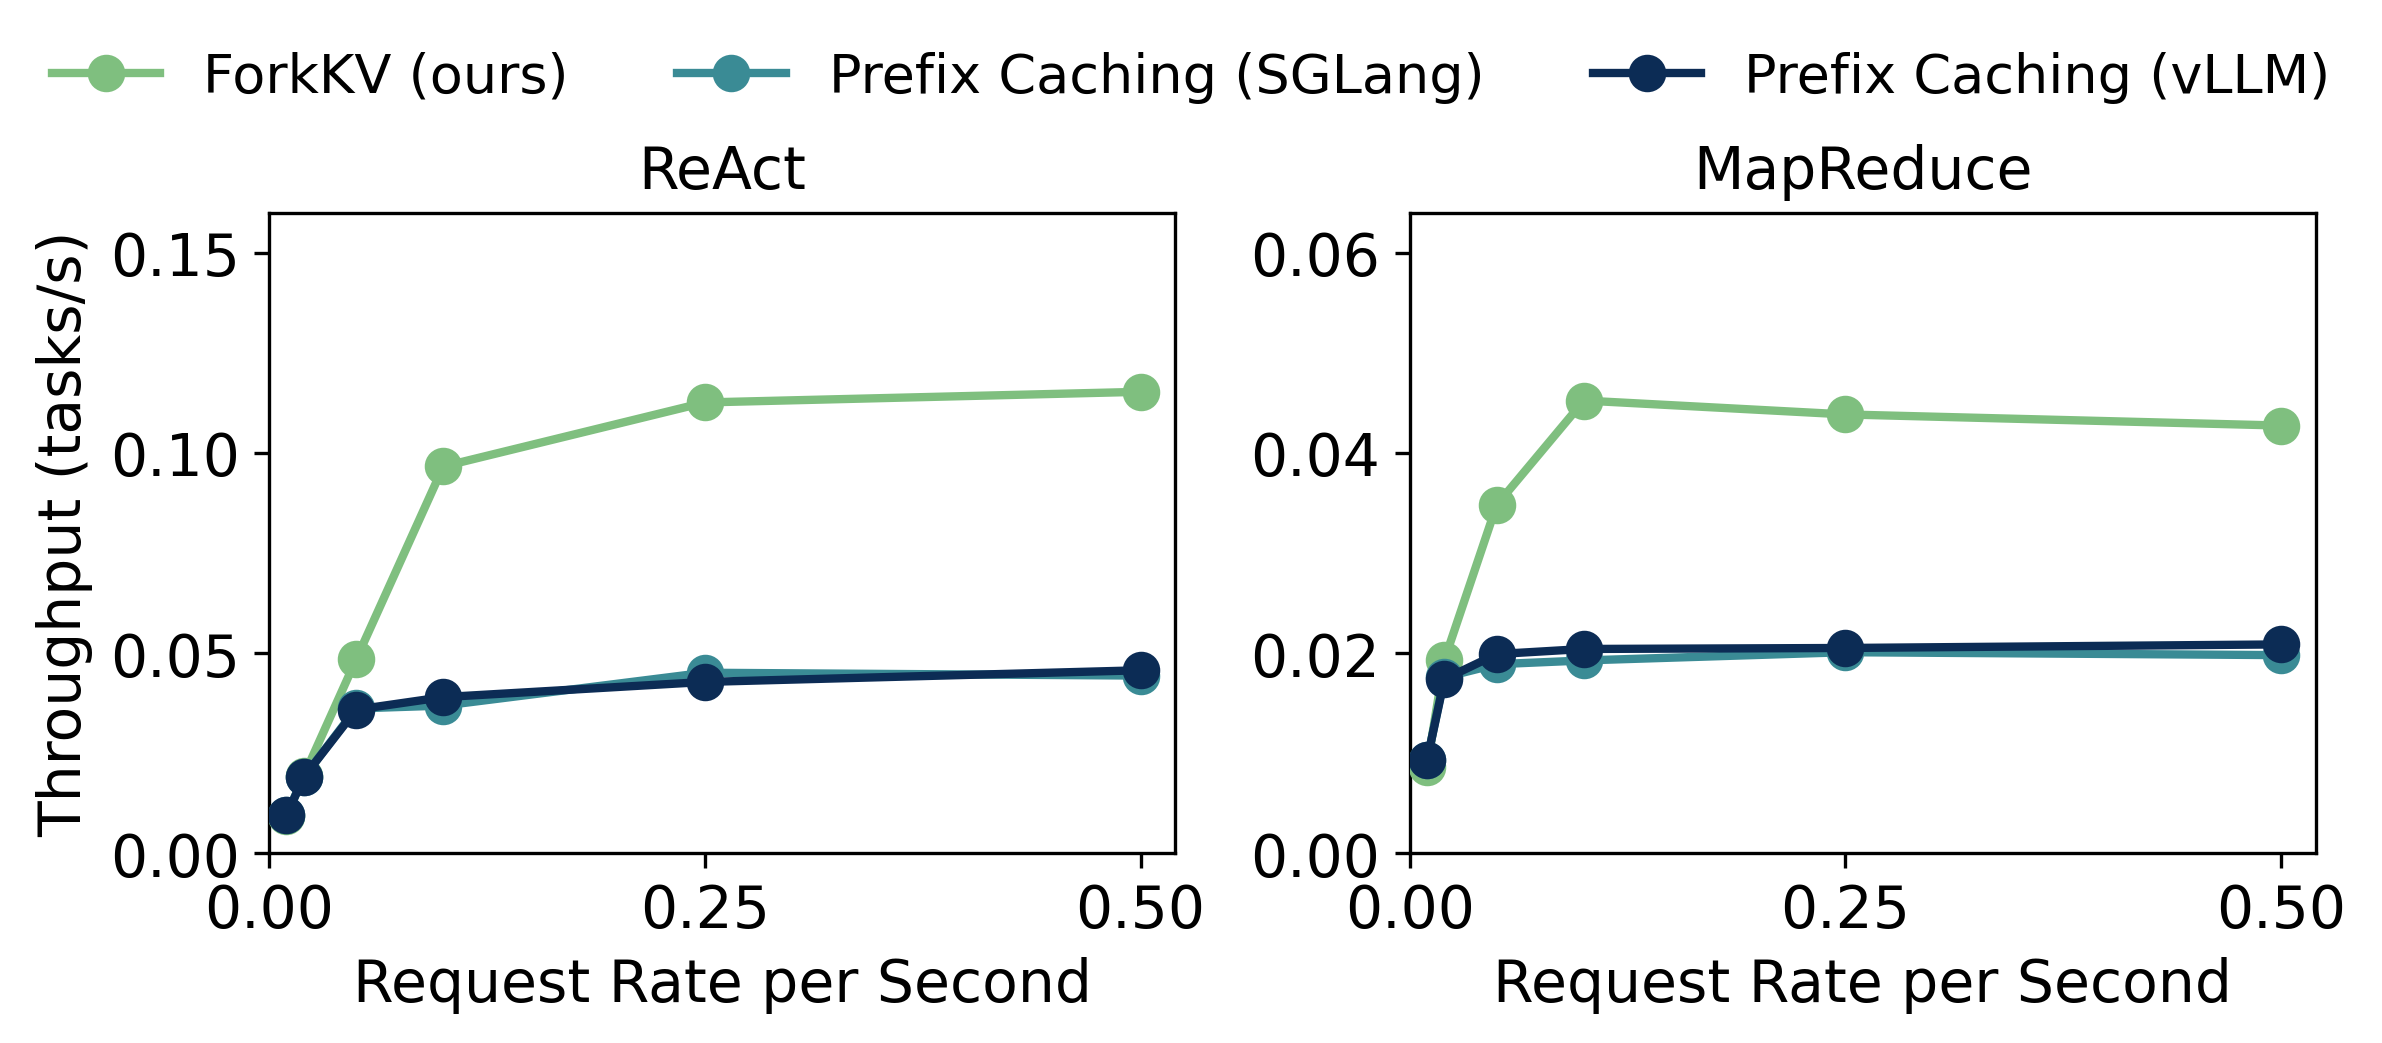
The image contains two line graphs comparing throughput (tasks/second) against request rate (requests/second) for three caching strategies: **ForkKV (ours)**, **Prefix Caching (SGLang)**, and **Prefix Caching (vLLM)**. The graphs are labeled **ReAct** (left) and **MapReduce** (right). Each graph shows performance trends across request rates from 0.00 to 0.50 requests/second.
---
### Components/Axes
- **X-axis**: Request Rate per Second (0.00 to 0.50 in increments of 0.05).
- **Y-axis**: Throughput (tasks/second) with ranges:
- ReAct: 0.00 to 0.15
- MapReduce: 0.00 to 0.06
- **Legend**:
- Green: ForkKV (ours)
- Teal: Prefix Caching (SGLang)
- Dark Blue: Prefix Caching (vLLM)
- **Graph Titles**:
- Left: "ReAct"
- Right: "MapReduce"
---
### Detailed Analysis
#### ReAct Graph
- **ForkKV (Green)**:
- Starts at ~0.05 tasks/s at 0.00 requests/s.
- Sharp increase to ~0.10 tasks/s at 0.10 requests/s.
- Plateaus at ~0.11 tasks/s from 0.25 to 0.50 requests/s.
- **Prefix Caching (SGLang, Teal)**:
- Starts at ~0.02 tasks/s at 0.00 requests/s.
- Gradual rise to ~0.04 tasks/s at 0.25 requests/s.
- Flattens at ~0.04 tasks/s at 0.50 requests/s.
- **Prefix Caching (vLLM, Dark Blue)**:
- Starts at ~0.01 tasks/s at 0.00 requests/s.
- Slightly higher than SGLang at all points (~0.03–0.04 tasks/s).
#### MapReduce Graph
- **ForkKV (Green)**:
- Starts at ~0.01 tasks/s at 0.00 requests/s.
- Sharp rise to ~0.04 tasks/s at 0.10 requests/s.
- Slight decline to ~0.03 tasks/s at 0.50 requests/s.
- **Prefix Caching (SGLang, Teal)**:
- Starts at ~0.01 tasks/s at 0.00 requests/s.
- Gradual rise to ~0.02 tasks/s at 0.25 requests/s.
- Flattens at ~0.02 tasks/s at 0.50 requests/s.
- **Prefix Caching (vLLM, Dark Blue)**:
- Starts at ~0.01 tasks/s at 0.00 requests/s.
- Slightly higher than SGLang at all points (~0.02–0.03 tasks/s).
---
### Key Observations
1. **ForkKV Dominates**:
- In both workloads, ForkKV consistently achieves higher throughput than Prefix Caching strategies.
- In ReAct, ForkKV maintains a ~2–3x advantage over Prefix Caching at higher request rates.
- In MapReduce, the gap narrows but ForkKV still outperforms (~1.5x at 0.50 requests/s).
2. **Performance Trends**:
- **ReAct**: ForkKV plateaus at ~0.11 tasks/s, suggesting scalability limits. Prefix Caching strategies show minimal improvement beyond 0.25 requests/s.
- **MapReduce**: ForkKV’s throughput declines slightly at higher request rates, while Prefix Caching strategies remain flat.
3. **Request Rate Sensitivity**:
- ForkKV’s performance improves sharply with request rate in both workloads, indicating better concurrency handling.
- Prefix Caching strategies show diminishing returns as request rates increase.
---
### Interpretation
- **ForkKV’s Advantage**: The caching strategy labeled "ForkKV (ours)" demonstrates superior throughput efficiency, likely due to optimized resource utilization or reduced contention. This is critical for high-throughput systems.
- **Workload Differences**:
- In ReAct, ForkKV’s plateau suggests it may struggle with extremely high request rates, while Prefix Caching strategies remain stable but underperform.
- In MapReduce, ForkKV’s slight decline at 0.50 requests/s hints at potential overhead at peak loads, whereas Prefix Caching strategies remain consistent but less efficient.
- **Practical Implications**:
- ForkKV is preferable for workloads requiring high throughput (e.g., ReAct).
- Prefix Caching (vLLM) may be more stable under moderate loads but lacks scalability.
- **Anomalies**:
- The sharp rise in ForkKV’s ReAct graph at 0.10 requests/s suggests a threshold effect, possibly due to parallelization or caching efficiency.
- The decline in ForkKV’s MapReduce graph at 0.50 requests/s may indicate resource contention or algorithmic limitations at extreme scales.
This analysis underscores the importance of caching strategy selection based on workload characteristics and system requirements.