## 3D Pyramid Diagram: Hierarchical Categorization Model
### Overview
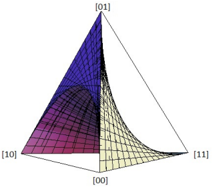
The image depicts a 3D pyramid structure with four triangular faces, labeled vertices, and color-coded regions. The pyramid is divided into three distinct color zones (blue, purple, yellow) with varying shading intensities, suggesting a hierarchical or categorical relationship between the regions. The base vertex is labeled [00], while the apex is [01], and the base edges are labeled [10] and [11].
### Components/Axes
- **Vertices**:
- Apex: [01] (top)
- Base vertices: [00] (bottom center), [10] (bottom left), [11] (bottom right)
- **Faces**:
- Four triangular faces connecting the vertices.
- **Color Legend** (right side):
- **Blue**: Largest region, dominant shading.
- **Purple**: Medium region, moderate shading.
- **Yellow**: Smallest region, minimal shading.
- **Grid Lines**: Black grid overlaying the pyramid for spatial reference.
### Detailed Analysis
- **Color Distribution**:
- **Blue** occupies the majority of the pyramid, concentrated near the apex [01] and extending toward the base edge [10].
- **Purple** is confined to the lower-left triangular face, adjacent to [10] and [00].
- **Yellow** is limited to the lower-right triangular face, near [11] and [00].
- **Shading Intensity**:
- Blue exhibits the darkest shading, transitioning to lighter tones toward the edges.
- Purple and yellow regions have progressively lighter shading, with yellow being the lightest.
- **Spatial Relationships**:
- The blue region dominates the upper and central portions of the pyramid.
- Purple and yellow regions are isolated to the base edges, with no overlap.
### Key Observations
1. **Hierarchical Dominance**: The blue region’s size and shading suggest it represents the primary category or highest priority.
2. **Categorical Segmentation**: Purple and yellow regions are distinct and non-overlapping, indicating mutually exclusive categories.
3. **Shading Ambiguity**: The gradient shading lacks a numerical scale, making quantitative interpretation speculative. It may represent depth, intensity, or another qualitative variable.
4. **Vertex Labeling**: The labels [00], [01], [10], [11] imply a binary or binary-derived coordinate system (e.g., binary states or binary decisions).
### Interpretation
The diagram likely represents a **hierarchical categorization model** or **decision tree**, where:
- The **blue region** signifies the dominant or most probable outcome (e.g., a primary class in classification).
- The **purple and yellow regions** represent secondary or conditional outcomes, possibly dependent on specific inputs (e.g., [10] and [11] as binary inputs).
- The **shading intensity** could metaphorically indicate confidence, priority, or resource allocation, though this is not explicitly defined.
- The **binary vertex labels** ([00], [01], etc.) suggest a connection to binary logic, computational models, or Boolean systems.
### Limitations
- No numerical data or explicit legend for shading intensity is provided, limiting quantitative analysis.
- The diagram’s purpose (e.g., decision-making, classification, resource distribution) is inferred rather than explicitly stated.
This structure emphasizes categorical relationships over quantitative metrics, prioritizing visual hierarchy and spatial segmentation.