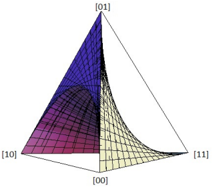
## 3D Plot: Ternary Diagram
### Overview
The image is a 3D ternary diagram, displaying a surface plotted within a triangular space. The vertices of the triangle are labeled [01], [10], and [11], with [00] at the base. The surface is colored with a gradient, transitioning from blue to pink to yellow, indicating a change in value across the ternary space.
### Components/Axes
* **Vertices:**
* Top: \[01]
* Left: \[10]
* Right: \[11]
* Base: \[00]
### Detailed Analysis
The surface plotted within the ternary diagram exhibits the following characteristics:
* **Region near \[01]:** The surface is colored blue and forms a steep, curved shape, indicating a high value in this region.
* **Region near \[10]:** The surface is colored pink and slopes downward from the \[01] vertex, indicating a decreasing value as it approaches \[10].
* **Region near \[11]:** The surface is colored yellow and slopes downward from the \[01] vertex, indicating a decreasing value as it approaches \[11].
* **Region near \[00]:** The surface is colored yellow and forms a relatively flat area, indicating a low value in this region.
### Key Observations
* The highest values are concentrated near the \[01] vertex.
* The values decrease as you move away from the \[01] vertex towards the other vertices.
* The lowest values are found near the \[00] vertex.
### Interpretation
The ternary diagram visualizes a function or property that depends on three components, represented by the vertices \[10], \[01], and \[11]. The color gradient on the surface indicates the magnitude of this function or property for different combinations of the three components. The concentration of high values near \[01] suggests that this component has a dominant influence on the function or property being visualized. The low values near \[00] suggest that this combination of components results in a minimal effect.