\n
## 3D Ternary Surface Plot: Binary State Distribution
### Overview
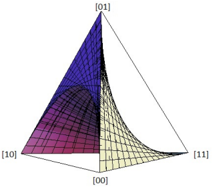
The image displays a three-dimensional surface plot rendered within a tetrahedral coordinate system. The plot visualizes a continuous surface defined over a triangular domain, with vertices labeled with binary pairs. The surface exhibits a complex, curved topology with a prominent peak and a saddle-like structure, suggesting a non-linear relationship or probability distribution across the defined states.
### Components/Axes
* **Coordinate System:** A 3D tetrahedral frame.
* **Vertices (Labeled Points):**
* Top vertex: `[01]`
* Bottom-left vertex: `[10]`
* Bottom-right vertex: `[11]`
* Bottom-center vertex (implied origin): `[00]`
* **Surface:** A continuous, mesh-grid surface plotted within the tetrahedron. The surface is colored with a gradient.
* **Color Mapping:** The surface uses a color gradient that transitions from deep purple/blue in one region to bright yellow in another, likely representing the magnitude of a third variable (Z-axis value) at each (X,Y) point on the triangular base.
### Detailed Analysis
* **Surface Topology:** The surface is not flat. It rises to a pronounced peak near the `[01]` vertex. From this peak, it slopes downward in a curved fashion towards the edge connecting `[10]` and `[11]`. There is a visible saddle point or inflection where the curvature changes.
* **Grid Mesh:** The surface is rendered with a black wireframe grid, which helps visualize its 3D contours and the rate of change across the domain.
* **Color Gradient & Spatial Grounding:**
* The region closest to the `[01]` vertex is colored in dark blue/purple.
* As the surface moves away from `[01]` and towards the `[10]-[11]` edge, the color transitions through magenta and pink.
* The area near the `[11]` vertex and along the `[00]-[11]` edge is colored in bright yellow.
* This suggests the measured value (Z-axis) is lowest (dark blue) near `[01]` and highest (yellow) near `[11]`, with intermediate values in between. The gradient is smooth, indicating a continuous function.
### Key Observations
1. **Asymmetric Peak:** The highest point of the surface is not centrally located but is skewed strongly towards the `[01]` vertex.
2. **Edge Dominance:** The surface appears to have its most dramatic curvature and color change along the path from `[01]` down to the `[11]` vertex.
3. **Binary Labels:** The vertex labels (`[00]`, `[01]`, `[10]`, `[11]`) represent the four possible states of a two-bit binary system. The plot likely maps a continuous variable (e.g., probability, energy, cost) onto this state space.
### Interpretation
This visualization likely represents a **probability distribution, energy landscape, or cost function** over the state space of a two-bit system.
* **What it Suggests:** The system has a strong preference or lower energy state (depending on the variable plotted) associated with the `[01]` configuration, as indicated by the peak. The `[11]` state is associated with the highest value of the plotted variable (yellow), which could represent high probability, high energy, or high cost. The smooth surface implies that transitions between these discrete binary states can be modeled as a continuous process.
* **Relationships:** The plot shows that the variable of interest does not change linearly between states. The path from `[01]` to `[11]` involves a significant and non-uniform change, as shown by the steep color gradient and surface curvature. The saddle shape suggests there may be a "pass" or lower-energy transition path between other states (e.g., from `[10]` towards `[00]`).
* **Anomalies/Notable Features:** The most notable feature is the sharp, localized peak at `[01]`. In a physical system, this could indicate a highly stable ground state. In a machine learning context, it might represent the most likely predicted outcome. The absence of a similar peak at `[00]` (the "all off" state) is significant, indicating the system is biased towards at least one bit being active.