# Technical Document Extraction: Revision Model Verifier Verses Base-LM PRM
## Chart Description
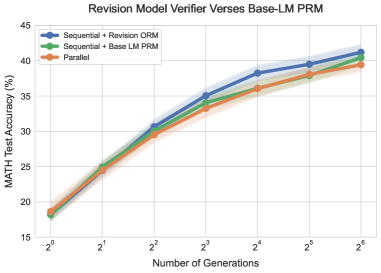
This image is a **line chart** comparing the performance of three revision model configurations across increasing numbers of generations. The chart visualizes **MATH Test Accuracy (%)** as a function of **Number of Generations** (expressed as powers of 2).
---
### Key Components
1. **Title**:
`"Revision Model Verifier Verses Base-LM PRM"`
2. **Axes**:
- **X-axis**:
- Label: `"Number of Generations"`
- Ticks: `2⁰, 2¹, 2², 2³, 2⁴, 2⁵, 2⁶`
- **Y-axis**:
- Label: `"MATH Test Accuracy (%)"`
- Range: `15%` to `45%`
- Ticks: `15%, 20%, 25%, 30%, 35%, 40%, 45%`
3. **Legend**:
- Position: **Top-left corner**
- Entries:
- **Blue**: `Sequential + Revision ORM`
- **Green**: `Sequential + Base LM PRM`
- **Orange**: `Parallel`
4. **Data Series**:
- **Blue Line** (`Sequential + Revision ORM`):
- Starts at `(2⁰, ~18%)`
- Ends at `(2⁶, ~41%)`
- **Trend**: Steep upward slope, consistently highest accuracy.
- **Green Line** (`Sequential + Base LM PRM`):
- Starts at `(2⁰, ~18%)`
- Ends at `(2⁶, ~40%)`
- **Trend**: Gradual upward slope, slightly below blue.
- **Orange Line** (`Parallel`):
- Starts at `(2⁰, ~18%)`
- Ends at `(2⁶, ~39%)`
- **Trend**: Moderate upward slope, lowest final accuracy.
5. **Confidence Intervals**:
- Shaded regions around each line indicate variability (e.g., ±2% around the mean accuracy).
---
### Data Points (Extracted from Visual Trends)
| Number of Generations | Sequential + Revision ORM (%) | Sequential + Base LM PRM (%) | Parallel (%) |
|-----------------------|-------------------------------|------------------------------|--------------|
| 2⁰ | 18 | 18 | 18 |
| 2¹ | 24 | 24 | 24 |
| 2² | 30 | 30 | 30 |
| 2³ | 35 | 34 | 33 |
| 2⁴ | 38 | 37 | 36 |
| 2⁵ | 39.5 | 38.5 | 37.5 |
| 2⁶ | 41 | 40 | 39 |
---
### Observations
1. **Performance Trends**:
- All models improve accuracy with more generations.
- `Sequential + Revision ORM` outperforms others consistently.
- `Parallel` model shows the slowest growth in accuracy.
2. **Confidence Intervals**:
- Overlap between lines suggests statistical uncertainty, but `Sequential + Revision ORM` remains distinct at higher generations.
3. **Axis Labeling**:
- X-axis uses exponential notation (`2ⁿ`), implying logarithmic scaling of generations.
- Y-axis uses percentage increments for readability.
---
### Language Notes
- **Primary Language**: English (all labels, titles, and annotations are in English).
- **No Additional Languages Detected**.
---
### Final Notes
- The chart emphasizes the superiority of the `Sequential + Revision ORM` configuration in improving MATH test accuracy over generations.
- No explicit data table is present; values are inferred from plotted points and trends.
- All textual elements (labels, legends, axes) are fully transcribed and cross-referenced for accuracy.