## Flowchart: AI System Development Lifecycle
### Overview
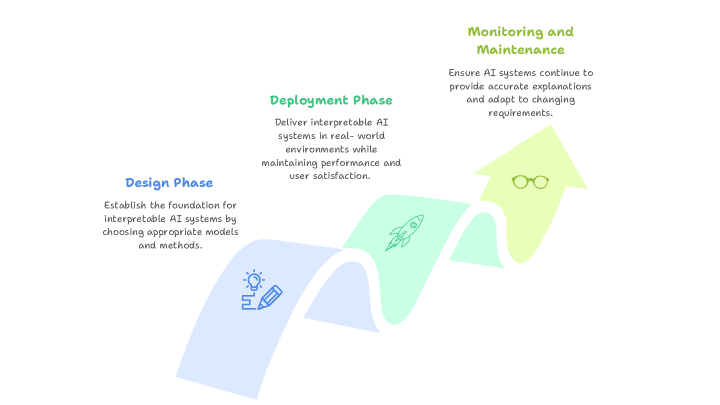
The image depicts a three-phase lifecycle for developing interpretable AI systems, represented as a horizontal flow with color-coded arrows and icons. Each phase includes a descriptive text block and a symbolic icon.
### Components/Axes
- **Phases**:
1. **Design Phase** (Blue section)
- Icon: Lightbulb + pencil
- Description: "Establish the foundation for interpretable AI systems by choosing appropriate models and methods."
2. **Deployment Phase** (Green section)
- Icon: Rocket
- Description: "Deliver interpretable AI systems in real-world environments while maintaining performance and user satisfaction."
3. **Monitoring and Maintenance** (Yellow-green section)
- Icon: Glasses
- Description: "Ensure AI systems continue to provide accurate explanations and adapt to changing requirements."
- **Arrows**: Green upward-pointing arrows connect phases sequentially (Design → Deployment → Monitoring/Maintenance).
### Detailed Analysis
- **Design Phase**: Focuses on foundational model selection and methodological choices for interpretability.
- **Deployment Phase**: Emphasizes real-world implementation with performance/user satisfaction constraints.
- **Monitoring/Maintenance**: Highlights ongoing adaptation and explanation accuracy requirements.
### Key Observations
- Phases are arranged in a left-to-right sequence with ascending vertical positioning (Design at bottom, Monitoring/Maintenance at top).
- Iconography reinforces phase objectives: creativity (Design), progress (Deployment), and oversight (Maintenance).
- No numerical data or quantitative metrics present.
### Interpretation
This flowchart illustrates a prescriptive workflow for responsible AI development, emphasizing:
1. **Intentional Design**: Prioritizing interpretability from the outset through model/method selection.
2. **Real-World Viability**: Balancing deployment performance with user satisfaction.
3. **Continuous Improvement**: Treating interpretability as an ongoing process requiring adaptation to evolving requirements.
The absence of quantitative data suggests this is a conceptual framework rather than an empirical study. The color progression (blue → green → yellow-green) visually reinforces the lifecycle progression from foundational work to operational maintenance.