## Box Plot: Performance Comparison of mTPI2 vs mTPI
### Overview
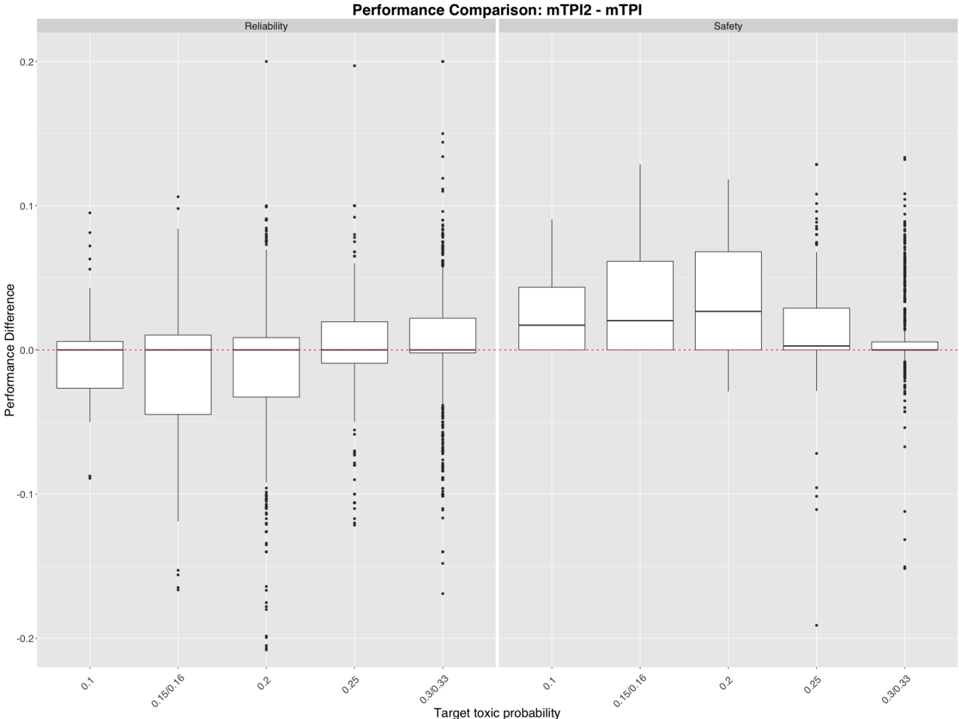
The image presents a box plot comparing the performance difference between two methods, mTPI2 and mTPI, across varying target toxic probabilities. The plot is divided into two sections, labeled "Reliability" and "Safety," each displaying box plots for the performance difference at target toxic probabilities of 0.1, 0.15/0.16, 0.2, 0.25, and 0.3/0.33.
### Components/Axes
* **Title:** Performance Comparison: mTPI2 - mTPI
* **X-axis:** Target toxic probability, with values 0.1, 0.15/0.16, 0.2, 0.25, and 0.3/0.33.
* **Y-axis:** Performance Difference, ranging from -0.2 to 0.2.
* **Sections:** The plot is divided into two sections, labeled "Reliability" (left) and "Safety" (right).
* **Reference Line:** A horizontal dotted red line is present at Performance Difference = 0.0.
### Detailed Analysis
**Reliability Section:**
* **Target toxic probability 0.1:** The box plot is centered slightly below 0.0. The box extends from approximately -0.05 to 0.01. There are several outliers both above and below the box.
* **Target toxic probability 0.15/0.16:** The box plot is centered around 0.0. The box extends from approximately -0.04 to 0.02. There are several outliers both above and below the box.
* **Target toxic probability 0.2:** The box plot is centered around 0.0. The box extends from approximately -0.05 to 0.03. There are several outliers both above and below the box.
* **Target toxic probability 0.25:** The box plot is centered slightly above 0.0. The box extends from approximately -0.03 to 0.04. There are several outliers both above and below the box.
* **Target toxic probability 0.3/0.33:** The box plot is centered around 0.0. The box extends from approximately -0.01 to 0.03. There are several outliers both above and below the box.
**Safety Section:**
* **Target toxic probability 0.1:** The box plot is centered slightly above 0.0. The box extends from approximately 0.0 to 0.06. There are several outliers both above and below the box.
* **Target toxic probability 0.15/0.16:** The box plot is centered above 0.0. The box extends from approximately 0.01 to 0.07. There are several outliers both above and below the box.
* **Target toxic probability 0.2:** The box plot is centered above 0.0. The box extends from approximately 0.02 to 0.08. There are several outliers both above and below the box.
* **Target toxic probability 0.25:** The box plot is centered around 0.0. The box extends from approximately -0.01 to 0.06. There are several outliers both above and below the box.
* **Target toxic probability 0.3/0.33:** The box plot is centered around 0.0. The box extends from approximately -0.01 to 0.01. There are several outliers both above and below the box.
### Key Observations
* The performance difference between mTPI2 and mTPI varies with the target toxic probability.
* In the "Reliability" section, the median performance difference is generally close to zero for all target toxic probabilities.
* In the "Safety" section, the median performance difference tends to be slightly above zero for lower target toxic probabilities (0.1, 0.15/0.16, 0.2) and closer to zero for higher target toxic probabilities (0.25, 0.3/0.33).
* The presence of outliers indicates variability in the performance difference for both reliability and safety.
* The box plots in the "Safety" section appear to have a higher median performance difference for lower target toxic probabilities compared to the "Reliability" section.
### Interpretation
The box plot suggests that mTPI2 and mTPI have varying performance differences depending on the target toxic probability and whether the metric is "Reliability" or "Safety." The "Safety" section shows a tendency for mTPI2 to outperform mTPI at lower target toxic probabilities, while the "Reliability" section shows performance differences centered around zero. The outliers indicate that the performance difference can be highly variable in certain cases. The dotted red line at zero serves as a reference point to easily visualize whether mTPI2 is performing better or worse than mTPI. The data suggests that the choice between mTPI2 and mTPI might depend on the specific target toxic probability and the desired balance between reliability and safety.