## Boxplot: Performance Comparison: mTPI2 - mTPI
### Overview
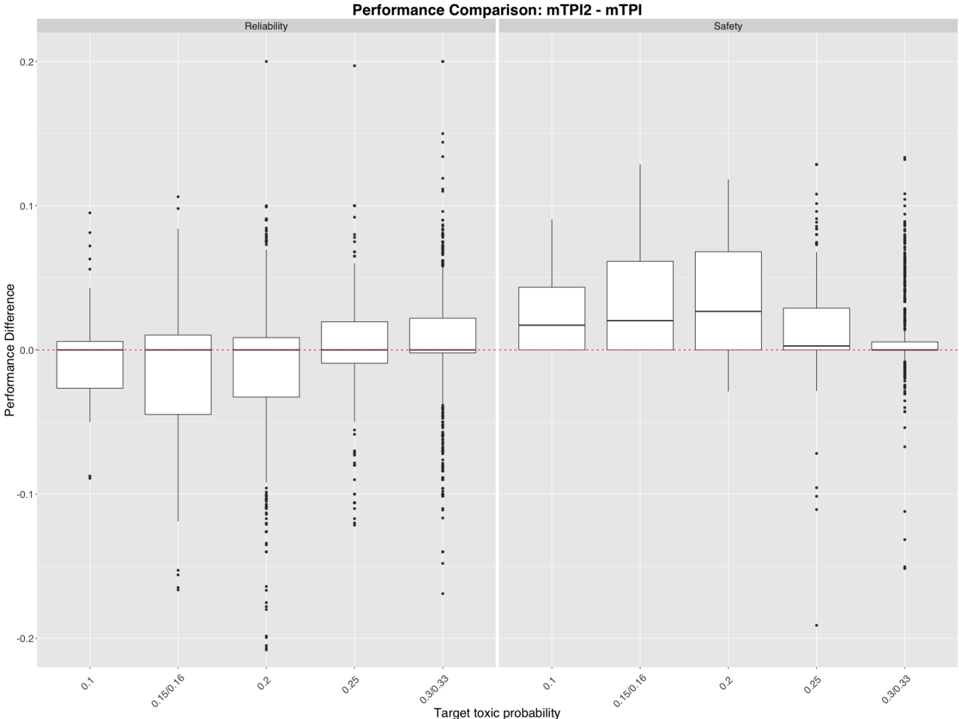
The image presents a series of boxplots comparing the performance difference between mTPI2 and mTPI across different target toxic probability levels. The plot is divided into two sections: "Reliability" on the left and "Safety" on the right. Each section contains boxplots for five different target toxic probability values.
### Components/Axes
* **Title:** Performance Comparison: mTPI2 - mTPI
* **X-axis:** Target toxic probability. Markers are: 0.1, 0.15/0.16, 0.2, 0.25, 0.3/0.33
* **Y-axis:** Performance Difference. Scale ranges from approximately -0.2 to 0.2.
* **Sections:** Reliability (left) and Safety (right). These are indicated by text labels at the top of each section.
* **Boxplots:** Each boxplot represents the distribution of performance differences for a specific target toxic probability.
### Detailed Analysis
The boxplots show the median, quartiles, and outliers for the performance difference.
**Reliability Section:**
* **0.1:** The boxplot is centered around approximately 0.01. The interquartile range (IQR) is roughly between -0.02 and 0.04. There are several outliers below -0.15.
* **0.15/0.16:** The boxplot is centered around approximately 0.00. The IQR is roughly between -0.03 and 0.03. There are a few outliers below -0.15.
* **0.2:** The boxplot is centered around approximately 0.00. The IQR is roughly between -0.03 and 0.03. There are a few outliers below -0.15.
* **0.25:** The boxplot is centered around approximately 0.00. The IQR is roughly between -0.03 and 0.04. There are a few outliers below -0.15.
* **0.3/0.33:** The boxplot is centered around approximately 0.00. The IQR is roughly between -0.03 and 0.04. There are several outliers below -0.15.
**Safety Section:**
* **0.1:** The boxplot is centered around approximately 0.00. The IQR is roughly between -0.03 and 0.03. There are a few outliers below -0.1.
* **0.15/0.16:** The boxplot is centered around approximately 0.00. The IQR is roughly between -0.03 and 0.03. There are a few outliers below -0.1.
* **0.2:** The boxplot is centered around approximately 0.01. The IQR is roughly between -0.03 and 0.04. There are a few outliers below -0.1.
* **0.25:** The boxplot is centered around approximately 0.00. The IQR is roughly between -0.03 and 0.04. There are a few outliers below -0.1.
* **0.3/0.33:** The boxplot is centered around approximately 0.00. The IQR is roughly between -0.03 and 0.04. There are a few outliers below -0.1.
### Key Observations
* In the Reliability section, the performance difference tends to be slightly positive for the lowest target toxic probability (0.1), but is generally around zero for the other probabilities. There are more outliers in the Reliability section, particularly at the lower probabilities.
* In the Safety section, the performance difference is consistently around zero across all target toxic probabilities.
* The spread of the data (as indicated by the IQR and whiskers) is similar across most target toxic probabilities within each section.
* Outliers are present in both sections, suggesting some instances where the performance difference is significantly different from the typical range.
### Interpretation
The data suggests that mTPI2 and mTPI perform similarly across most target toxic probability levels, as indicated by the performance differences being centered around zero. However, there is some evidence that mTPI2 may perform slightly better than mTPI at lower target toxic probabilities in terms of Reliability. The presence of outliers indicates that there are cases where the performance difference is substantial, potentially due to specific input characteristics or edge cases. The Safety section shows a very consistent performance difference of approximately zero, suggesting that the two models perform equally well in terms of safety across all tested probabilities. The larger number of outliers in the Reliability section suggests that this metric is more sensitive to variations in input data or model behavior. The boxplot visualization effectively communicates the distribution of performance differences and highlights potential areas of concern or improvement.