TECHNICAL ASSET FINGERPRINT
d04d7206a5a57b7ef995b23b
Click to view fullscreen
Press ESC or click to close
FOUND IN PAPERS
EXPERT: healer-alpha-free VERSION 1
RUNTIME: free/openrouter/healer-alpha
INTEL_VERIFIED
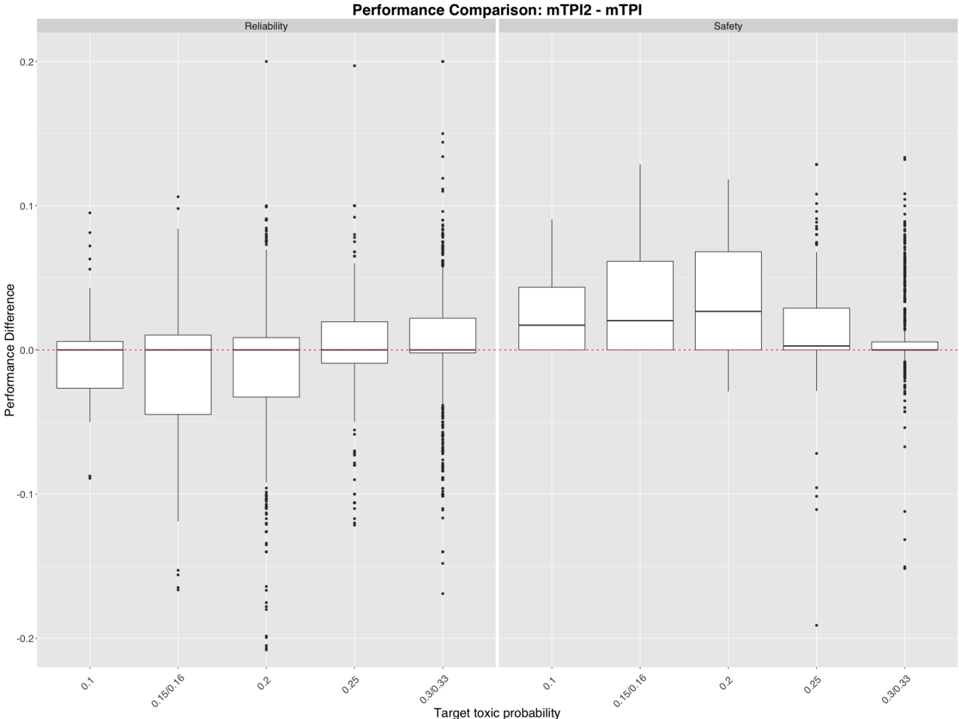
## Box Plot Comparison: Performance Difference (mTPI2 - mTPI)
### Overview
The image is a faceted box plot comparing the performance difference between two methods, mTPI2 and mTPI, across two metrics: **Reliability** and **Safety**. The comparison is made at different levels of a "Target toxic probability." The plot shows the distribution of the performance difference (mTPI2 minus mTPI) for each category. A positive value indicates mTPI2 performed better, while a negative value indicates mTPI performed better.
### Components/Axes
* **Main Title:** "Performance Comparison: mTPI2 - mTPI"
* **Facet Panels (Top Labels):**
* Left Panel: "Reliability"
* Right Panel: "Safety"
* **Y-Axis:**
* **Label:** "Performance Difference"
* **Scale:** Linear, ranging from approximately -0.2 to +0.2.
* **Key Reference Line:** A horizontal red dashed line at y = 0.0, indicating no performance difference.
* **X-Axis:**
* **Label:** "Target toxic probability"
* **Categories (Tick Labels):** The same set of categories appears under both panels:
* `0.1`
* `0.15/0.16`
* `0.2`
* `0.25`
* `0.30/0.33`
* **Plot Elements:** Standard box-and-whisker plots. Each box represents the interquartile range (IQR, 25th to 75th percentile). The horizontal line within each box is the median. Whiskers extend to the most extreme data points within 1.5 * IQR. Individual points beyond the whiskers are outliers.
### Detailed Analysis
#### **Left Panel: Reliability**
* **Trend:** The median performance difference for Reliability hovers very close to the zero line across all target toxic probability categories. There is no strong, consistent directional trend (upward or downward) in the medians as the target probability increases.
* **Data Points (Approximate Medians & Spread):**
* `0.1`: Median ≈ 0.0. Box spans from ~ -0.02 to +0.01. Whiskers extend from ~ -0.05 to +0.05. Several outliers above +0.05, with one near +0.1.
* `0.15/0.16`: Median ≈ 0.0. Box spans from ~ -0.04 to +0.01. Whiskers extend from ~ -0.12 to +0.08. Notable outliers below -0.15.
* `0.2`: Median ≈ 0.0. Box spans from ~ -0.03 to +0.01. Whiskers extend from ~ -0.05 to +0.05. **This category has the most extreme outliers**, with points reaching down to ~ -0.2 and up to +0.2.
* `0.25`: Median ≈ 0.0. Box spans from ~ -0.01 to +0.02. Whiskers extend from ~ -0.05 to +0.05. Outliers present both above and below.
* `0.30/0.33`: Median ≈ 0.0. Box spans from ~ -0.01 to +0.02. Whiskers extend from ~ -0.05 to +0.05. Outliers present, with a cluster below -0.1.
#### **Right Panel: Safety**
* **Trend:** The median performance difference for Safety is consistently **positive** for the first four categories (`0.1` to `0.25`), indicating mTPI2 generally outperforms mTPI on this metric. There is a clear **downward trend** in the median difference as the target toxic probability increases, approaching zero at the highest probability (`0.30/0.33`).
* **Data Points (Approximate Medians & Spread):**
* `0.1`: Median ≈ +0.02. Box spans from ~ 0.0 to +0.04. Upper whisker extends to ~ +0.09.
* `0.15/0.16`: Median ≈ +0.02. Box spans from ~ 0.0 to +0.06. Upper whisker extends to ~ +0.13.
* `0.2`: Median ≈ +0.025 (highest median in the plot). Box spans from ~ 0.0 to +0.07. Upper whisker extends to ~ +0.12.
* `0.25`: Median ≈ +0.01. Box spans from ~ 0.0 to +0.03. Upper whisker extends to ~ +0.05. Outliers present above +0.1.
* `0.30/0.33`: Median ≈ 0.0. Box is very compressed around zero. Whiskers are short. A dense vertical line of outliers extends from ~ -0.15 to +0.13, indicating high variance but no consistent advantage for either method.
### Key Observations
1. **Metric-Dependent Performance:** The performance difference is highly dependent on the metric. mTPI2 shows a clear, though diminishing, advantage in **Safety** for lower target toxic probabilities, but shows no consistent advantage or disadvantage in **Reliability**.
2. **Safety Advantage Erodes with Higher Toxicity:** The positive median difference in the Safety panel decreases as the "Target toxic probability" increases, vanishing at the `0.30/0.33` level.
3. **High Variance at Specific Points:** The `0.2` category in the Reliability panel shows extreme variance, with outliers spanning almost the entire y-axis range. The `0.30/0.33` category in the Safety panel also shows very high variance (many outliers) despite a median near zero.
4. **Consistent Zero-Line for Reliability:** The Reliability medians are remarkably stable at zero across all conditions, suggesting the two methods are statistically indistinguishable on this metric regardless of the target toxicity.
### Interpretation
This analysis suggests a **trade-off or context-dependent superiority** between the mTPI2 and mTPI methods.
* **For Safety-critical applications** where the target toxic probability is low to moderate (0.1 to 0.25), **mTPI2 is the preferable method**, as it demonstrates a consistent, positive performance difference. This could mean it better avoids toxic outputs or adheres to safety constraints under those conditions.
* **For Reliability,** there is **no evidence to prefer one method over the other** based on this data. Their performance distributions are centered on zero difference.
* **The convergence at high target toxicity (`0.30/0.33`)** is notable. It implies that when the system is explicitly tuned to accept a higher probability of toxic outcomes, the algorithmic differences between mTPI2 and mTPI become negligible for both Safety and Reliability. The high variance here suggests outcomes become more unpredictable for both methods.
* **The extreme outliers at `0.2` for Reliability** warrant investigation. This specific toxicity target may represent a "knife-edge" condition where the methods' behaviors diverge dramatically in rare cases, leading to both significant failures (large negative differences) and significant successes (large positive differences).
**In summary:** Choose mTPI2 over mTPI for safer operation at lower toxicity thresholds. For pure reliability or at high toxicity thresholds, the methods are functionally equivalent. The choice of target toxic probability is a critical parameter that influences not just the absolute performance, but the *relative* performance of these two algorithms.
DECODING INTELLIGENCE...