\n
## Text Document: Analysis of "Total agents over time"
### Overview
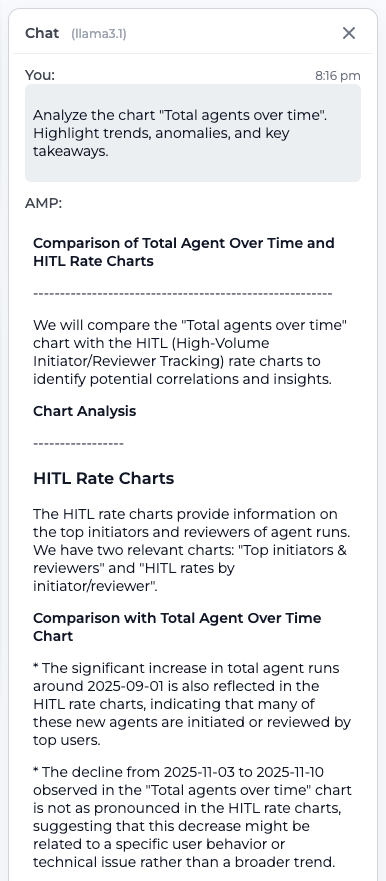
The image presents a screenshot of a chat conversation. The user requested an analysis of the chart "Total agents over time," highlighting trends, anomalies, and key takeaways. The response, provided by "AMP," is a textual analysis rather than a visual chart. It compares the "Total agents over time" chart with HITL (High-Volume Initiator/Reviewer Tracking) rate charts to identify correlations and insights.
### Components/Axes
The document does not contain a visual chart with axes or legends. It consists entirely of text. The analysis references two charts:
1. "Total agents over time"
2. HITL rate charts, specifically "Top initiators & reviewers" and "HITL rates by initiator/reviewer".
### Detailed Analysis or Content Details
The text provides the following key points:
* **Correlation with HITL Rate Charts:** The increase in total agent runs around 2025-09-01 is also reflected in the HITL rate charts, suggesting that many of these new agents were initiated or reviewed by top users.
* **Decline in Total Agents:** The decline in total agent runs from 2025-11-03 to 2025-11-10 is not as pronounced in the HITL rate charts. This suggests the decline might be due to specific user behavior or a technical issue rather than a broader trend.
### Key Observations
* The analysis highlights a correlation between the increase in total agents and activity by top users.
* The analysis suggests a potential disconnect between the decline in total agents and HITL rates, indicating a possible localized issue.
* The document provides dates (2025-09-01, 2025-11-03, 2025-11-10) as key points of observation.
### Interpretation
The analysis suggests that the growth of the agent pool is heavily influenced by the activity of top users. When top users are actively initiating or reviewing agents, the total number of agents increases. However, a decline in total agents doesn't necessarily mean a corresponding decline in HITL activity, implying that the decline might be caused by factors other than a general decrease in engagement from top users. This could indicate issues with onboarding, user experience, or technical problems affecting a subset of users. The analysis is limited by the lack of the actual charts, making it difficult to assess the magnitude of the correlations and the significance of the anomalies. The document is a qualitative interpretation of quantitative data, and the strength of the conclusions depends on the underlying data in the referenced charts.