## Screenshot: Chat Analysis of "Total Agents Over Time" Chart
### Overview
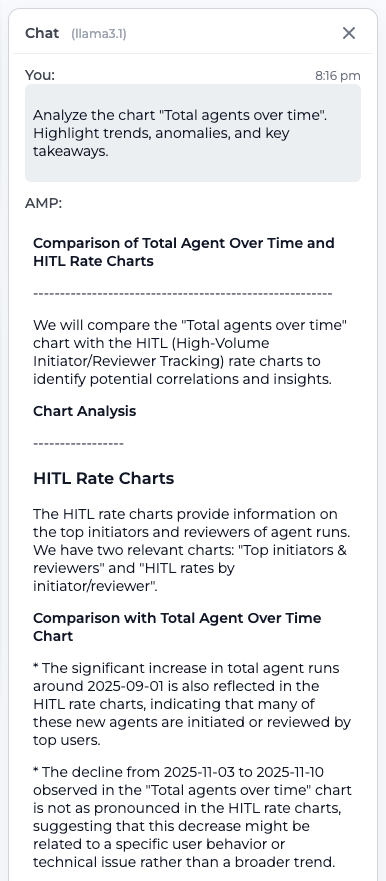
The image is a screenshot of a chat interface between a user and an AI assistant (AMP) discussing the analysis of a chart titled "Total agents over time." The user requested trend identification, anomaly detection, and key takeaways. The AI's response includes a comparative analysis with HITL (High-Volume Initiator/Reviewer Tracking) rate charts, observations about trends, and interpretations of anomalies.
### Components/Axes
- **Chat Interface Elements**:
- **Header**: "Chat (llama3.1)" with a close button (X) in the top-right corner.
- **Timestamp**: "8:16 pm" aligned to the right of the user's message.
- **User Message**: Gray background box with the query:
*"Analyze the chart 'Total agents over time'. Highlight trends, anomalies, and key takeaways."*
- **AI Response**: Structured text with bold headings and bullet points.
- **Textual Content**:
- **Headings**:
- "AMP:"
- "Comparison of Total Agent Over Time and HITL Rate Charts"
- "Chart Analysis"
- "HITL Rate Charts"
- "Comparison with Total Agent Over Time Chart"
- **Key Text**:
- *"We will compare the 'Total agents over time' chart with the HITL rate charts to identify potential correlations and insights."*
- *"The HITL rate charts provide information on the top initiators and reviewers of agent runs."*
- *"The significant increase in total agent runs around 2025-09-01 is also reflected in the HITL rate charts..."*
- *"The decline from 2025-11-03 to 2025-11-10 observed in the 'Total agents over time' chart is not as pronounced in the HITL rate charts..."*
### Detailed Analysis
- **Trends**:
- **Increase**: A notable rise in total agent runs around **2025-09-01**, mirrored in HITL rate charts.
- **Decline**: A drop in total agent runs from **2025-11-03 to 2025-11-10**, less evident in HITL charts.
- **Anomalies**:
- The divergence between the "Total agents over time" chart and HITL rate charts during the November 2025 decline suggests potential user-specific or technical factors.
- **Key Takeaways**:
- The September 2025 surge indicates heightened activity by top initiators/reviewers.
- The November 2025 decline may stem from isolated incidents (e.g., user behavior, technical glitches) rather than systemic trends.
### Key Observations
1. **Temporal Correlation**: The September 2025 increase aligns across both datasets, suggesting a systemic driver (e.g., policy change, marketing campaign).
2. **Divergence in November 2025**: The muted decline in HITL charts implies the drop in total agents is not uniformly experienced by top contributors.
3. **HITL Rate Charts**: These focus on high-volume agents, filtering out less active users, which explains their reduced sensitivity to the November decline.
### Interpretation
- **Systemic vs. Isolated Factors**: The September surge likely reflects a broad organizational shift (e.g., new tool adoption), while the November decline may involve specific users or technical issues (e.g., login failures, workflow bottlenecks).
- **HITL Charts as a Filter**: By focusing on high-volume agents, these charts obscure smaller-scale fluctuations, emphasizing the need for granular analysis to diagnose anomalies.
- **Actionable Insight**: Investigate the November 2025 period for user-specific issues (e.g., access logs, error reports) and validate the September surge with operational records (e.g., onboarding campaigns, system updates).
## Notes
- No visual chart or diagram is present in the image; all data is textual.
- Dates and trends are inferred from the AI's textual analysis, not direct visual inspection.
- The chat interface uses a minimalist design with bold headings and bullet points for clarity.