## Bar Chart: Mean Token Length by Correctness
### Overview
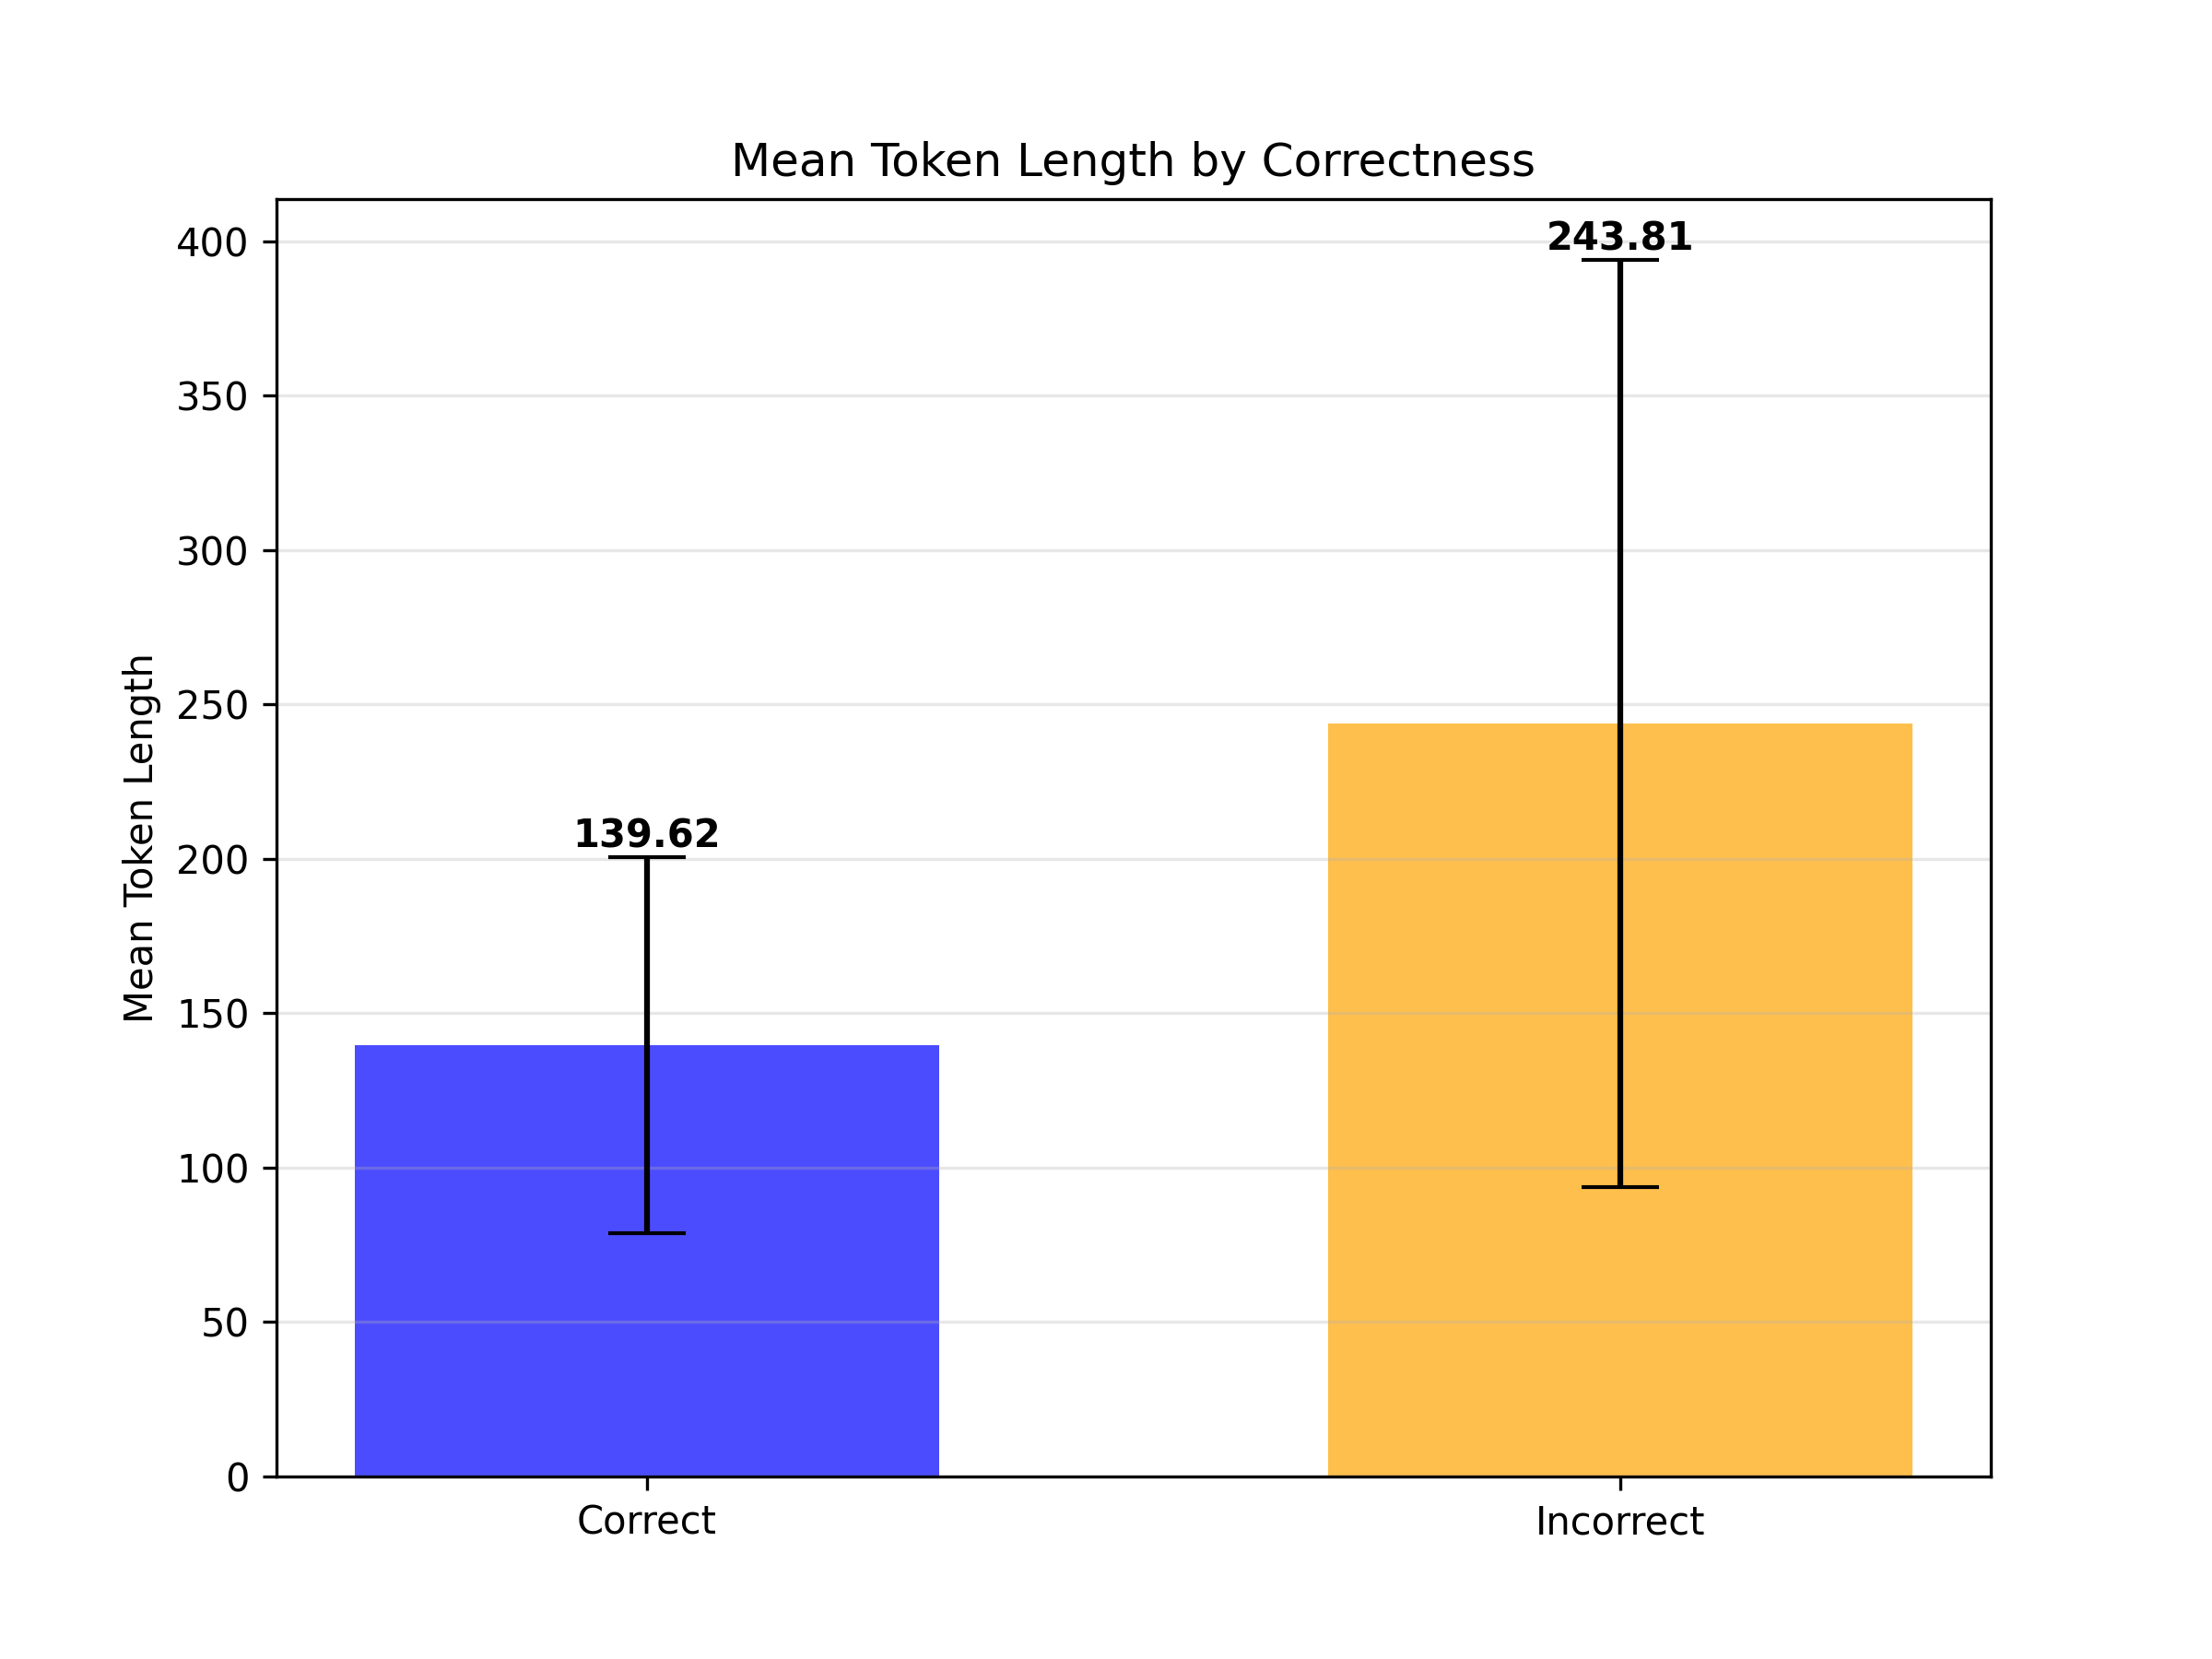
The image is a vertical bar chart comparing the mean token length for two categories: "Correct" and "Incorrect." The chart includes error bars for each category, indicating variability or confidence intervals around the mean. The overall design is clean with a white background and light gray horizontal grid lines.
### Components/Axes
* **Title:** "Mean Token Length by Correctness" (centered at the top).
* **Y-Axis:**
* **Label:** "Mean Token Length" (rotated vertically on the left side).
* **Scale:** Linear scale from 0 to 400, with major tick marks and grid lines at intervals of 50 (0, 50, 100, 150, 200, 250, 300, 350, 400).
* **X-Axis:**
* **Categories:** Two categorical bars labeled "Correct" (left) and "Incorrect" (right).
* **Data Series & Legend:**
* There is no separate legend box. The categories are identified by their x-axis labels and distinct bar colors.
* **"Correct" Bar:** Solid blue color.
* **"Incorrect" Bar:** Solid orange/yellow color.
* **Error Bars:** Black vertical lines with horizontal caps, extending above and below the top of each bar.
### Detailed Analysis
* **"Correct" Category (Blue Bar):**
* **Mean Value:** The top of the bar aligns with the value **139.62**, which is explicitly labeled above the bar.
* **Error Bar Range:** The error bar extends from approximately **80** (lower cap) to **200** (upper cap). The upper cap aligns with the 200 grid line.
* **"Incorrect" Category (Orange Bar):**
* **Mean Value:** The top of the bar aligns with the value **243.81**, which is explicitly labeled above the bar.
* **Error Bar Range:** The error bar extends from approximately **95** (lower cap) to **400** (upper cap). The upper cap aligns with the 400 grid line, which is the maximum value on the y-axis scale.
### Key Observations
1. **Magnitude Difference:** The mean token length for the "Incorrect" category (243.81) is substantially higher—approximately 74.6% greater—than the mean for the "Correct" category (139.62).
2. **Variability Difference:** The error bar for the "Incorrect" category is significantly larger (spanning ~305 units) compared to the error bar for the "Correct" category (spanning ~120 units). This indicates much greater variability or uncertainty in the token length data for incorrect responses.
3. **Range Overlap:** Despite the difference in means, the lower bound of the "Incorrect" error bar (~95) falls within the range of the "Correct" error bar (~80 to 200). This suggests that while incorrect responses are, on average, longer, there is an overlap where some incorrect responses have token lengths similar to correct ones.
### Interpretation
The data suggests a clear relationship between the correctness of a response and its length (in tokens). **Incorrect responses tend to be significantly longer on average than correct ones.** This could imply several underlying patterns:
* **Verbosity of Error:** Incorrect answers may involve more explanation, hedging, or tangential information as the model attempts (and fails) to arrive at a correct solution.
* **Confidence vs. Accuracy:** The model might generate longer, more elaborate text when it is less certain, which correlates with a higher likelihood of being incorrect.
* **Task Complexity:** More complex questions that are harder to answer correctly might also naturally elicit longer responses, confounding the relationship.
The dramatically larger error bar for the "Incorrect" category is a critical finding. It indicates that the token lengths of incorrect responses are highly inconsistent. This could be due to a mix of very short, abrupt errors and very long, convoluted ones. In contrast, correct responses appear to cluster more tightly around a shorter mean length, suggesting a more consistent pattern in how the model generates accurate answers.
**In summary, the chart provides evidence that response length is a potential indicator of correctness, with shorter responses being more likely to be correct, but with significant variability in the length of incorrect answers.**