## Bar Chart: Mean Token Length by Correctness
### Overview
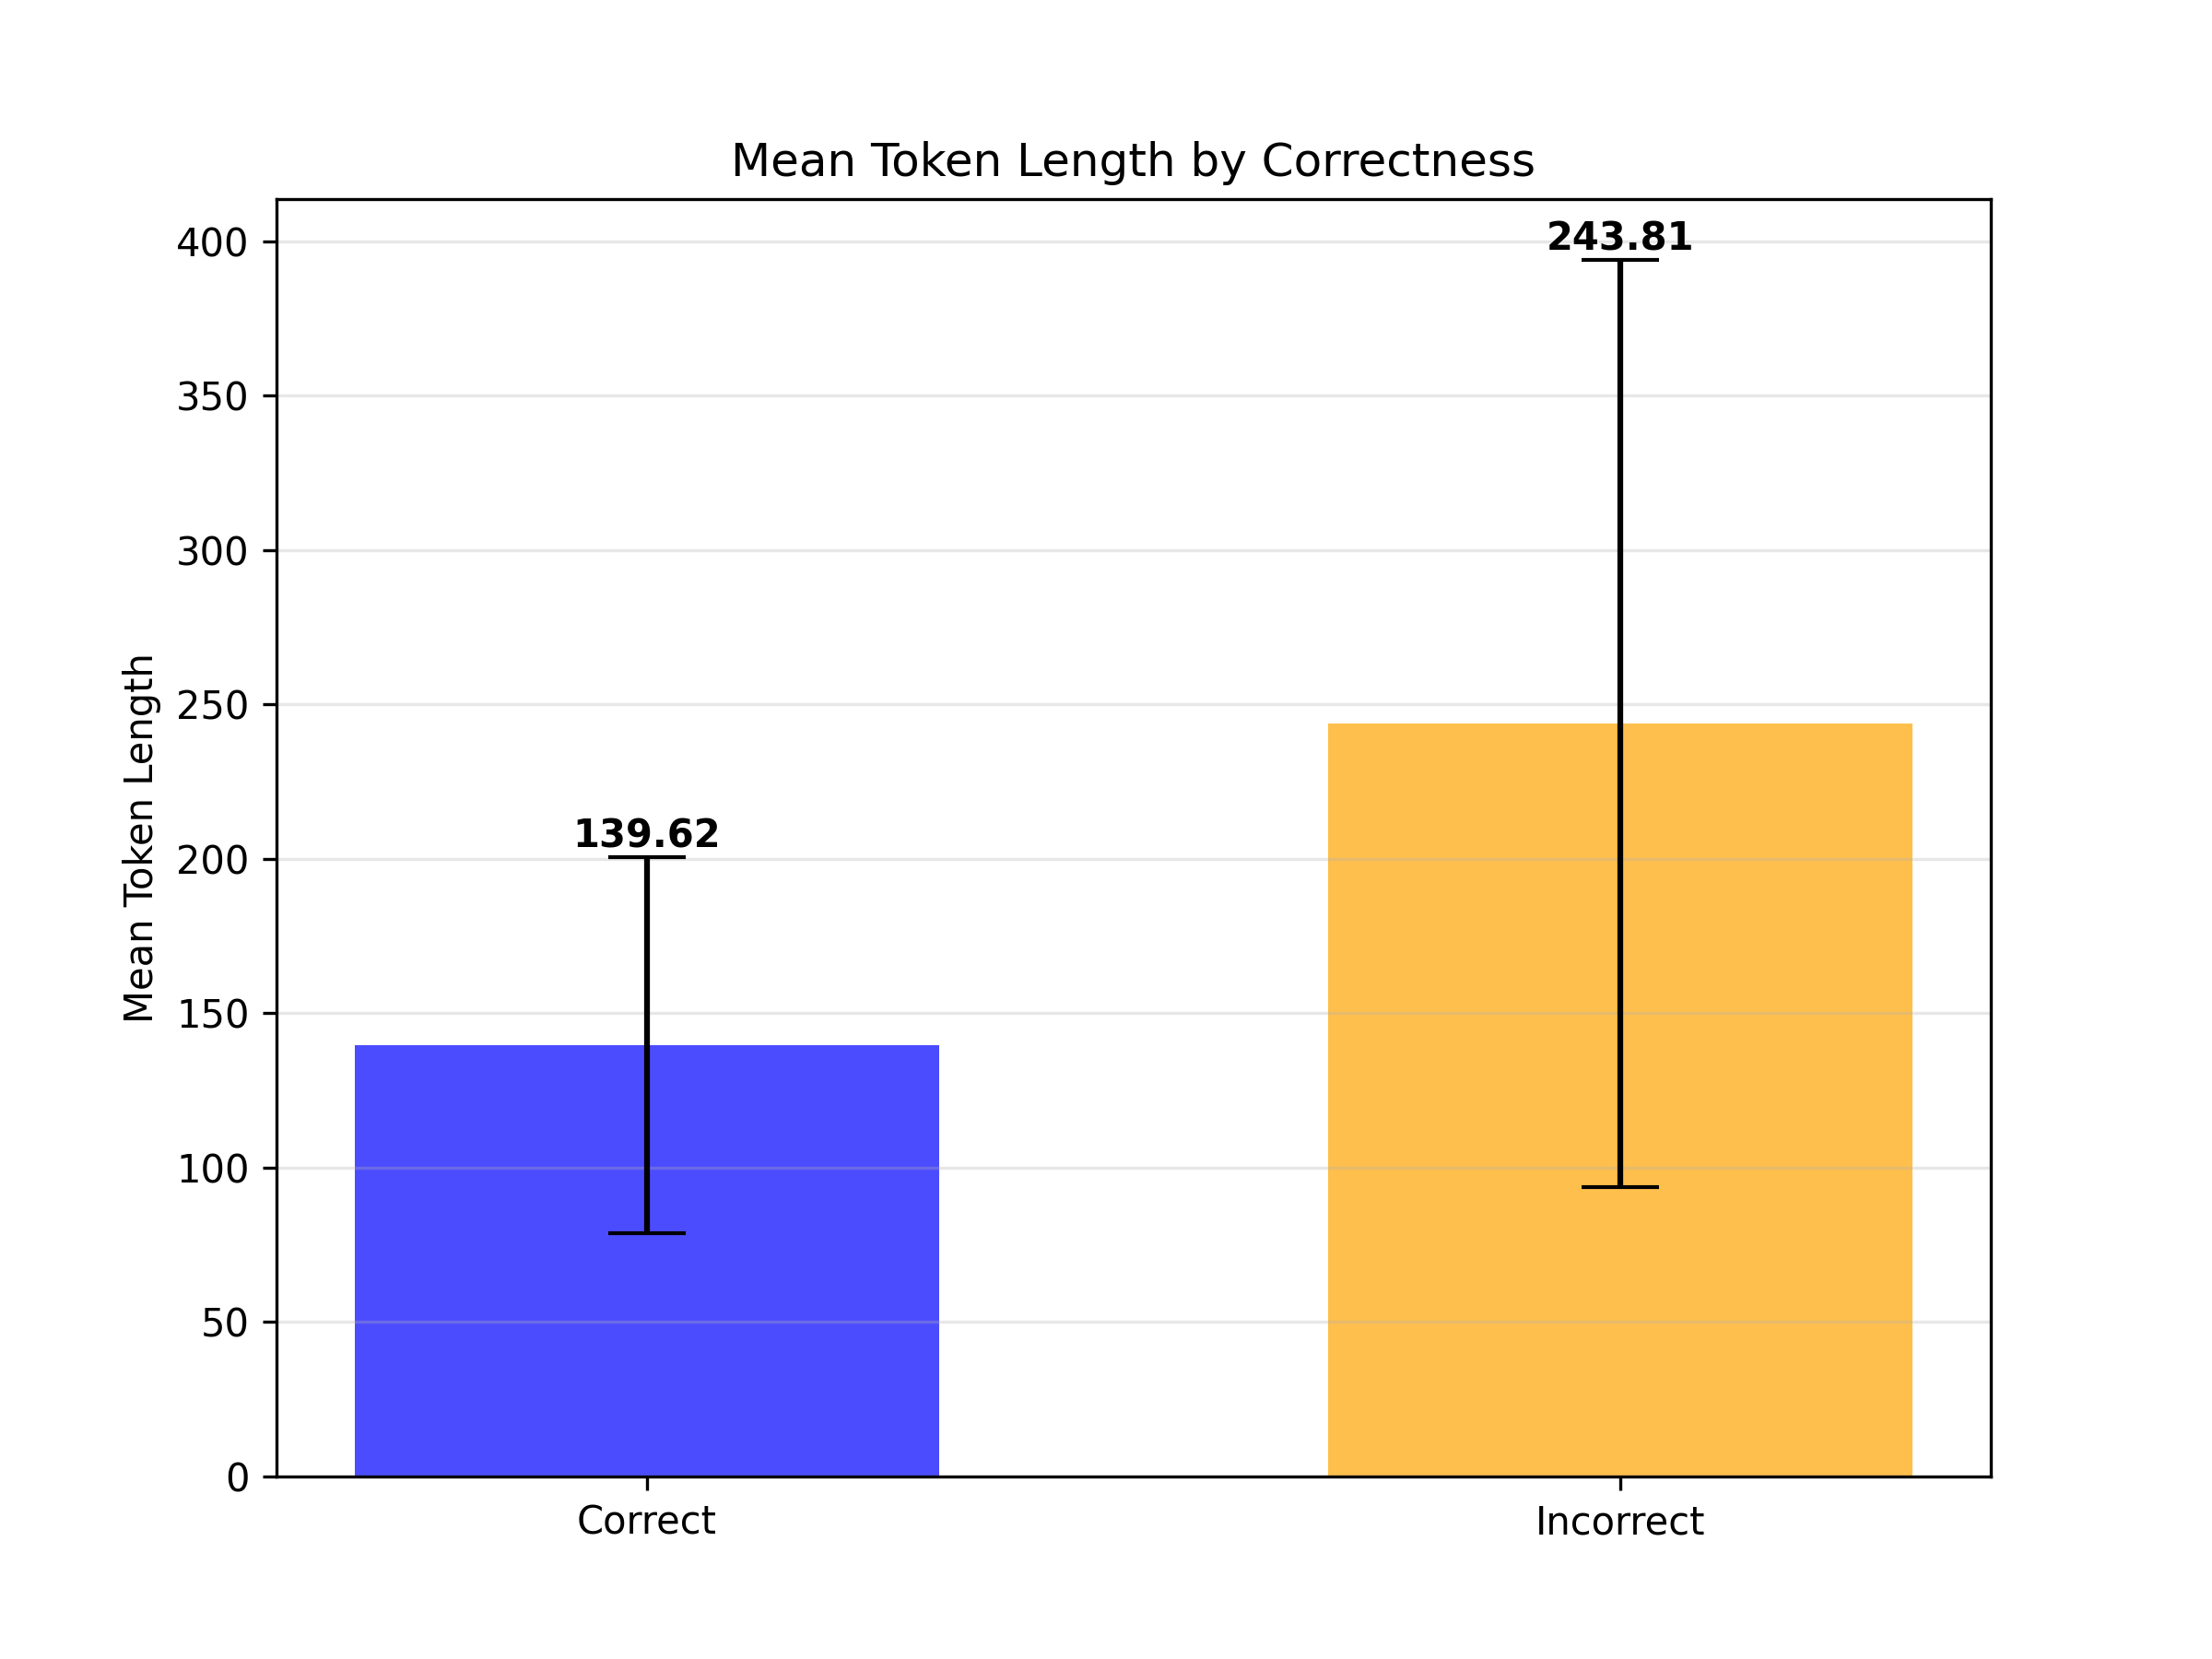
The chart compares mean token lengths for two categories: "Correct" and "Incorrect" responses. The "Correct" category shows a lower mean token length with smaller variability, while the "Incorrect" category exhibits a significantly higher mean token length and greater variability.
### Components/Axes
- **X-axis**: Labeled "Correct" (blue bar) and "Incorrect" (orange bar), positioned at the bottom.
- **Y-axis**: Labeled "Mean Token Length," scaled from 0 to 400 in increments of 50.
- **Legend**: Located at the bottom-right, matching bar colors (blue for "Correct," orange for "Incorrect").
- **Error Bars**: Vertical lines with caps indicating variability, positioned above each bar.
### Detailed Analysis
- **Correct Category**:
- Mean Token Length: **139.62** (blue bar).
- Error Range: Approximately **90–190** (calculated from the error bar length).
- **Incorrect Category**:
- Mean Token Length: **243.81** (orange bar).
- Error Range: Approximately **100–388** (calculated from the error bar length).
### Key Observations
1. The "Incorrect" category has a **mean token length 72% higher** than the "Correct" category (243.81 vs. 139.62).
2. Variability in token length is **significantly greater** for "Incorrect" responses (error range spans ~288 tokens vs. ~100 tokens for "Correct").
3. Error bars for "Incorrect" extend beyond the chart’s upper limit (388 > 400), suggesting extreme outliers or truncation.
### Interpretation
The data suggests that **incorrect responses are associated with longer token lengths**, potentially indicating:
- More verbose or elaborate explanations when the model is incorrect.
- Greater uncertainty or exploratory reasoning in incorrect outputs, leading to longer sequences.
- A possible correlation between response length and error likelihood, warranting further investigation into model behavior (e.g., whether longer responses are inherently more prone to errors or if errors drive verbosity).
The stark difference in mean values and variability highlights a critical distinction in output characteristics between correct and incorrect responses, which could inform strategies for error mitigation or model refinement.