## Histogram: Length Distribution of Accurate and Inaccurate Verifications
### Overview
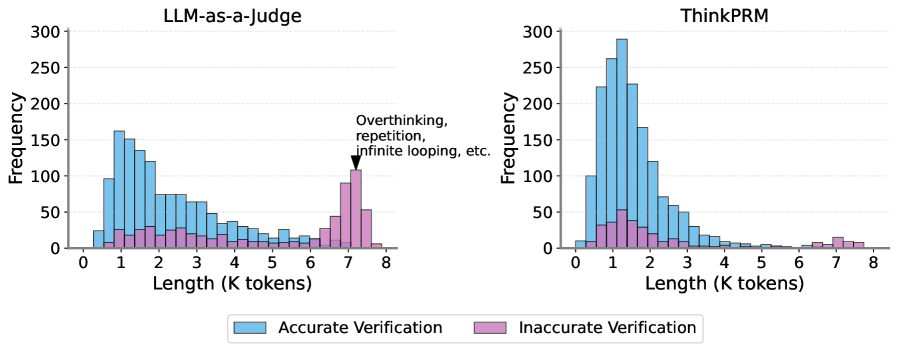
The image presents two histograms comparing the length distribution (in K tokens) of accurate and inaccurate verifications for two different systems: "LLM-as-a-Judge" and "ThinkPRM". The histograms display the frequency of different token lengths, with accurate verifications shown in light blue and inaccurate verifications in pink.
### Components/Axes
* **Titles:** "LLM-as-a-Judge" (left histogram), "ThinkPRM" (right histogram)
* **Y-axis:** "Frequency", ranging from 0 to 300 with increments of 50.
* **X-axis:** "Length (K tokens)", ranging from 0 to 8 with increments of 1.
* **Legend:** Located at the bottom of the image.
* Light Blue: "Accurate Verification"
* Pink: "Inaccurate Verification"
* **Annotation:** In the "LLM-as-a-Judge" histogram, there's an arrow pointing to the peak of the pink bars at length 7, with the text "Overthinking, repetition, infinite looping, etc."
### Detailed Analysis
**1. LLM-as-a-Judge (Left Histogram):**
* **Accurate Verification (Light Blue):**
* The frequency starts around 0 at length 0.
* It peaks at length 1 with a frequency of approximately 160.
* The frequency decreases gradually from length 1 to length 6, reaching a value of approximately 20.
* From length 6 to 8, the frequency remains relatively low, around 10-20.
* **Inaccurate Verification (Pink):**
* The frequency is low from length 0 to 6, generally below 50.
* There is a sharp peak at length 7, with a frequency of approximately 100.
* The frequency drops significantly at length 8, close to 0.
**2. ThinkPRM (Right Histogram):**
* **Accurate Verification (Light Blue):**
* The frequency starts around 0 at length 0.
* It peaks at length 1 with a frequency of approximately 280.
* The frequency decreases gradually from length 1 to length 6, reaching a value of approximately 10.
* From length 6 to 8, the frequency remains very low, close to 0.
* **Inaccurate Verification (Pink):**
* The frequency is relatively low across all lengths, generally below 60.
* There is a small peak at length 1, with a frequency of approximately 50.
* The frequency is very low from length 6 to 8, close to 0.
### Key Observations
* For both systems, accurate verifications are most frequent at shorter lengths (around 1K tokens).
* For "LLM-as-a-Judge", inaccurate verifications are concentrated at a length of 7K tokens, suggesting a tendency for overthinking or looping.
* For "ThinkPRM", inaccurate verifications are generally low across all lengths.
### Interpretation
The histograms suggest that "LLM-as-a-Judge" is prone to issues like overthinking or infinite looping when dealing with longer sequences (around 7K tokens), leading to inaccurate verifications. "ThinkPRM", on the other hand, appears to be more consistent in its verification accuracy across different sequence lengths. The data indicates that both systems perform accurate verifications more frequently with shorter sequences. The annotation on the "LLM-as-a-Judge" histogram highlights a specific failure mode related to longer sequences, which is not as prominent in "ThinkPRM".