\n
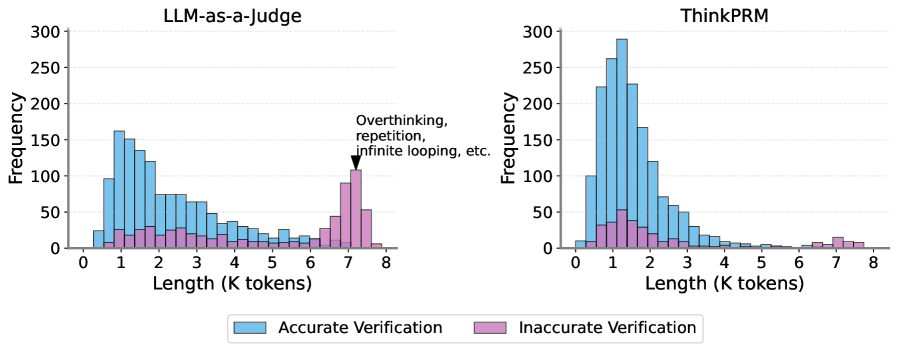
## Histograms: Verification Accuracy vs. Length (K tokens)
### Overview
The image presents two histograms, side-by-side, comparing the distribution of response lengths (in K tokens) for "Accurate Verification" and "Inaccurate Verification" cases. The left histogram represents data for "LLM-as-a-judge", and the right histogram represents data for "ThinkPRM". Both histograms share the same x and y axes scales. A text annotation on the right histogram points to the "Inaccurate Verification" distribution, labeling it as relating to "Overthinking, repetition, infinite looping, etc.".
### Components/Axes
* **X-axis:** "Length (K tokens)" - Ranges from 0 to 8, with tick marks at integer values.
* **Y-axis:** "Frequency" - Ranges from 0 to 300, with tick marks at intervals of 50.
* **Legend (bottom-center):**
* "Accurate Verification" - Represented by a light blue color.
* "Inaccurate Verification" - Represented by a light purple/pink color.
* **Titles:**
* Left Histogram: "LLM-as-a-judge"
* Right Histogram: "ThinkPRM"
* **Annotation:** "Overthinking, repetition, infinite looping, etc." - Points to the tail of the "Inaccurate Verification" distribution in the "ThinkPRM" histogram.
### Detailed Analysis or Content Details
**LLM-as-a-judge (Left Histogram):**
* **Accurate Verification (Blue):** The distribution is unimodal, peaking at approximately 0.8 K tokens. It slopes downward relatively smoothly from the peak, with a long tail extending towards 8 K tokens.
* Frequency at 0.8 K tokens: ~270
* Frequency at 1.6 K tokens: ~150
* Frequency at 2.4 K tokens: ~70
* Frequency at 3.2 K tokens: ~40
* Frequency at 4.0 K tokens: ~25
* Frequency at 4.8 K tokens: ~15
* Frequency at 5.6 K tokens: ~10
* Frequency at 6.4 K tokens: ~5
* Frequency at 7.2 K tokens: ~5
* **Inaccurate Verification (Purple):** The distribution is relatively flat with a small peak around 6.4 K tokens. It has a more pronounced tail extending towards 8 K tokens compared to the accurate verification distribution.
* Frequency at 0.8 K tokens: ~10
* Frequency at 1.6 K tokens: ~15
* Frequency at 2.4 K tokens: ~20
* Frequency at 3.2 K tokens: ~25
* Frequency at 4.0 K tokens: ~30
* Frequency at 4.8 K tokens: ~40
* Frequency at 5.6 K tokens: ~50
* Frequency at 6.4 K tokens: ~60
* Frequency at 7.2 K tokens: ~50
**ThinkPRM (Right Histogram):**
* **Accurate Verification (Blue):** Similar to LLM-as-a-judge, the distribution is unimodal, peaking at approximately 1.6 K tokens. It slopes downward from the peak.
* Frequency at 1.6 K tokens: ~280
* Frequency at 0.8 K tokens: ~200
* Frequency at 2.4 K tokens: ~120
* Frequency at 3.2 K tokens: ~60
* Frequency at 4.0 K tokens: ~30
* Frequency at 4.8 K tokens: ~15
* Frequency at 5.6 K tokens: ~10
* Frequency at 6.4 K tokens: ~5
* **Inaccurate Verification (Purple):** The distribution is more concentrated towards higher lengths (6.4-7.2 K tokens) than in the LLM-as-a-judge histogram. The annotation "Overthinking, repetition, infinite looping, etc." points to this region.
* Frequency at 1.6 K tokens: ~20
* Frequency at 2.4 K tokens: ~30
* Frequency at 3.2 K tokens: ~40
* Frequency at 4.0 K tokens: ~50
* Frequency at 4.8 K tokens: ~60
* Frequency at 5.6 K tokens: ~70
* Frequency at 6.4 K tokens: ~80
* Frequency at 7.2 K tokens: ~60
### Key Observations
* For both LLM-as-a-judge and ThinkPRM, accurate verifications tend to have shorter lengths than inaccurate verifications.
* The "Inaccurate Verification" distribution for ThinkPRM is more heavily skewed towards longer lengths (6-8 K tokens) and has a more pronounced peak in that region compared to LLM-as-a-judge.
* The annotation suggests that longer lengths in ThinkPRM are associated with issues like overthinking and repetition.
* The peak of accurate verifications is higher for ThinkPRM than for LLM-as-a-judge.
### Interpretation
The data suggests that both LLM-as-a-judge and ThinkPRM exhibit a correlation between response length and verification accuracy: longer responses are more likely to be inaccurate. However, this correlation is stronger for ThinkPRM. The annotation highlights a potential issue with ThinkPRM – it appears to be prone to generating overly verbose responses that are characterized by overthinking, repetition, or infinite looping, leading to inaccuracies.
The difference in distributions between the two models suggests that ThinkPRM might be more susceptible to these issues than LLM-as-a-judge. The higher peak in accurate verifications for ThinkPRM could indicate that when it *does* provide accurate responses, they are often more concise.
The histograms provide a visual representation of the trade-off between response length and accuracy. A potential area for improvement for ThinkPRM is to implement mechanisms to constrain response length and prevent the generation of overly detailed or repetitive outputs. The data supports the hypothesis that controlling length can improve accuracy.