# Technical Document Extraction: Scatter Plot Analysis
## Axis Labels and Titles
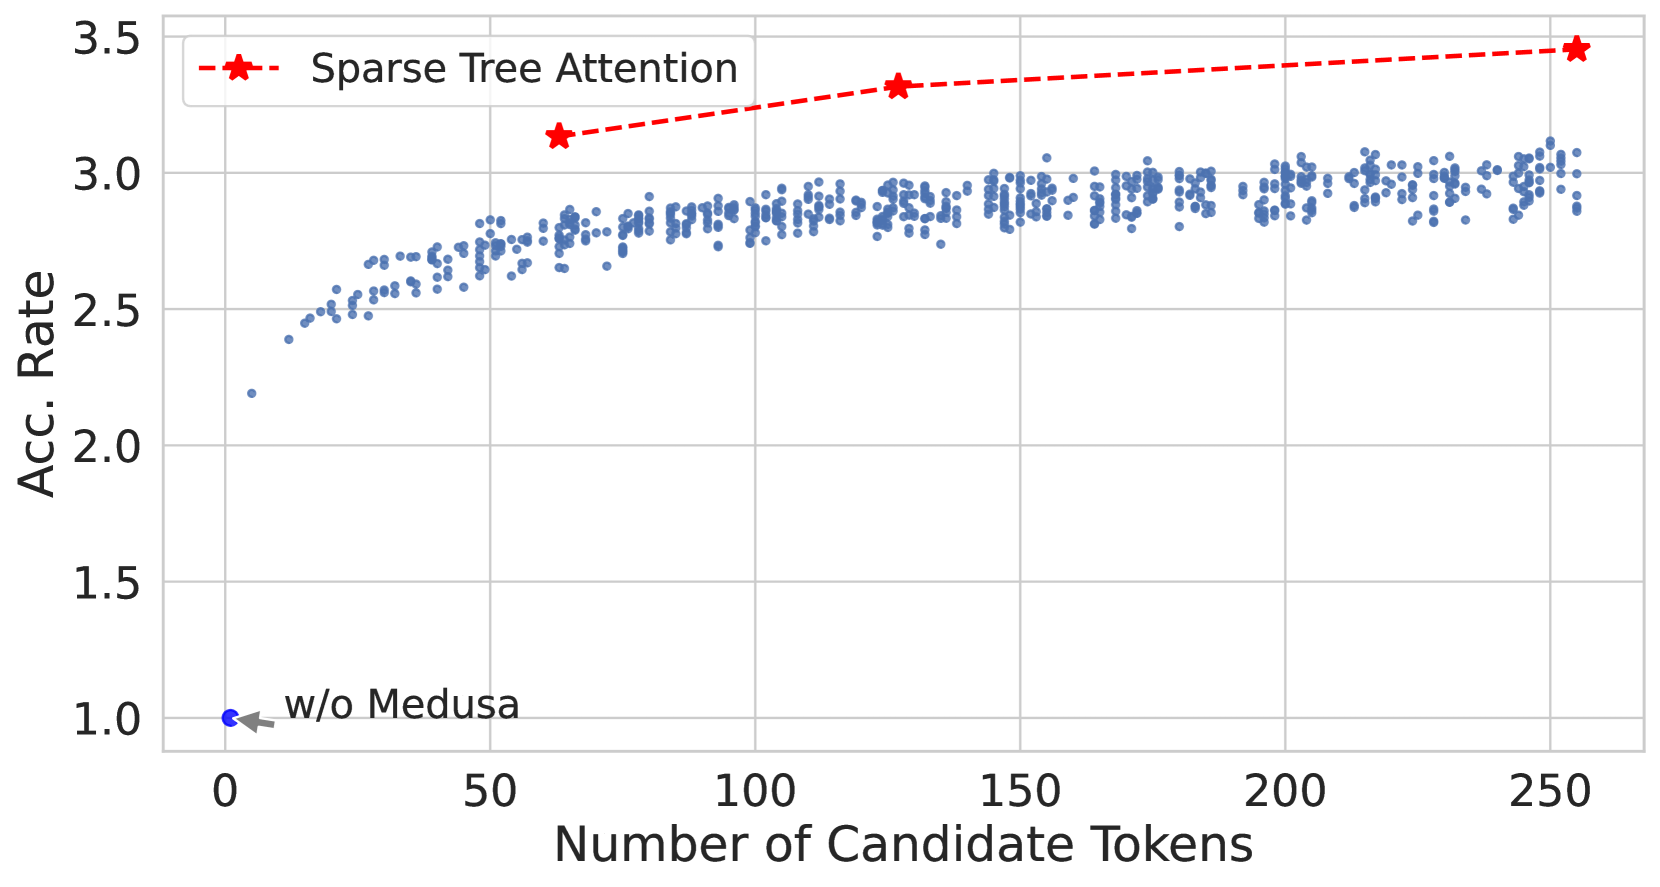
- **X-Axis**: "Number of Candidate Tokens" (Range: 0 to 250)
- **Y-Axis**: "Acc. Rate" (Accuracy Rate) (Range: 1.0 to 3.5)
## Legend
- **Red Dashed Line with Star Marker**: "Sparse Tree Attention"
## Data Points and Trends
1. **Blue Scatter Points**:
- Clustered between **2.5 and 3.0** on the Y-axis.
- Distributed across the full X-axis range (0–250 tokens).
- Density decreases slightly as X increases beyond 100 tokens.
2. **Red Dashed Line ("Sparse Tree Attention")**:
- Starts at **(50 tokens, 3.1 Acc. Rate)**.
- Increases to **(150 tokens, 3.3 Acc. Rate)**.
- Reaches **(250 tokens, 3.5 Acc. Rate)**.
- Shows a consistent upward trend with increasing candidate tokens.
3. **Notable Anomaly**:
- A single blue point at **(0 tokens, 1.0 Acc. Rate)** labeled **"w/o Medusa"**.
- Indicates baseline performance without Medusa integration.
## Structural Observations
- **Grid**: Present (horizontal and vertical lines at integer intervals).
- **No Additional Elements**: No grid annotations, error bars, or secondary axes.
- **Data Distribution**: Blue points exhibit variability but stabilize near 3.0 Acc. Rate for X > 100.
## Cross-Reference Validation
- **Legend Alignment**: Red dashed line with star markers matches the plotted trendline.
- **Color Consistency**: Blue points correspond to raw data; red line represents modeled trend.
## Summary
The plot illustrates the relationship between the number of candidate tokens and accuracy rate. The "Sparse Tree Attention" model demonstrates a positive correlation between token count and performance, achieving 3.5 Acc. Rate at 250 tokens. Baseline performance ("w/o Medusa") is significantly lower at 1.0 Acc. Rate with zero tokens.