TECHNICAL ASSET FINGERPRINT
d079f6da0536daa0cd0fe384
Click to view fullscreen
Press ESC or click to close
FOUND IN PAPERS
EXPERT: gemini-3.1-pro-preview VERSION 1
RUNTIME: gemini/gemini-3.1-pro-preview
INTEL_VERIFIED
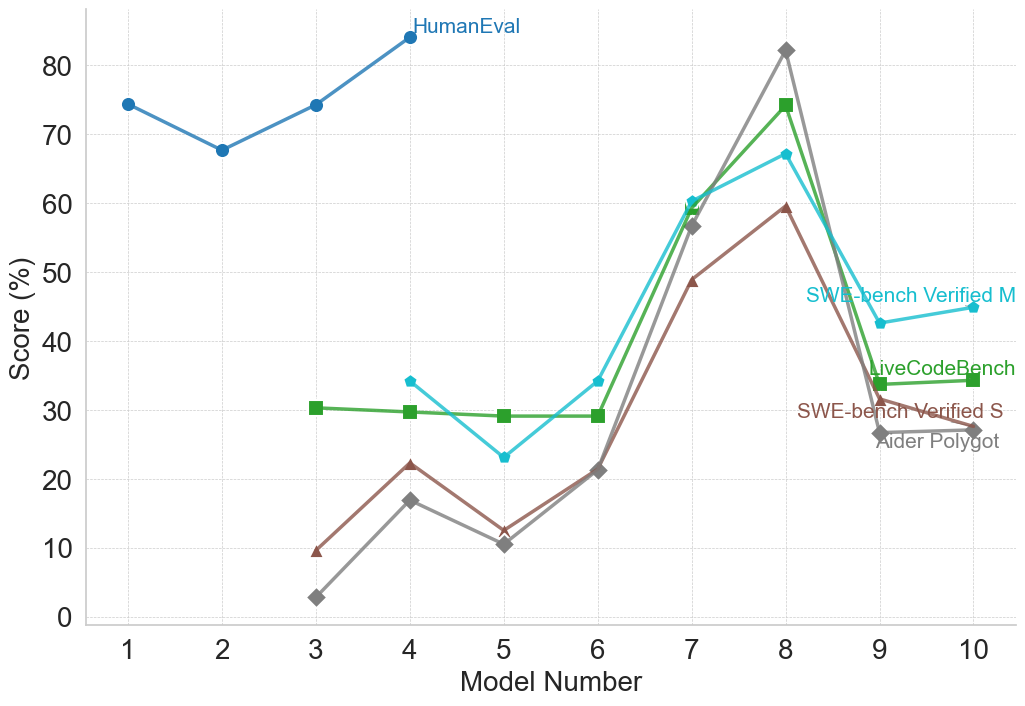
## Line Chart: Benchmark Scores Across Different Models
### Overview
This image is a line chart displaying the performance scores (in percentages) of various models across five different benchmarks. The chart tracks "Score (%)" on the vertical axis against "Model Number" on the horizontal axis. Instead of a traditional legend box, the data series are labeled directly on the chart canvas adjacent to their respective lines.
### Components/Axes
* **Y-Axis (Left):** Labeled "Score (%)". The scale ranges from 0 to 80, with major tick marks and corresponding labels at intervals of 10 (0, 10, 20, 30, 40, 50, 60, 70, 80). There is an unlabeled gridline above 80, representing 90.
* **X-Axis (Bottom):** Labeled "Model Number". The scale ranges from 1 to 10, with major tick marks and integer labels for every number (1, 2, 3, 4, 5, 6, 7, 8, 9, 10).
* **Gridlines:** The chart features a background grid of light gray, dashed lines corresponding to every major tick on both the X and Y axes.
* **Labels (Inline Legend):**
* "HumanEval" (Top center, dark blue text)
* "SWE-bench Verified M" (Middle right, cyan text)
* "LiveCodeBench" (Middle right, green text)
* "SWE-bench Verified S" (Lower right, brown text)
* "Aider Polygot" (Lower right, gray text)
### Detailed Analysis
*Note: All numerical values are visual approximations extracted from the chart.*
**1. HumanEval (Dark Blue Line, Circular Markers)**
* **Spatial Grounding:** The label is located at the top center of the chart, immediately to the right of the data point at Model 4.
* **Visual Trend:** This series only spans Models 1 through 4. It starts high, dips slightly at Model 2, recovers at Model 3, and rises to the highest overall point on the chart at Model 4.
* **Data Points:**
* Model 1: ~74%
* Model 2: ~68%
* Model 3: ~74%
* Model 4: ~84%
**2. SWE-bench Verified M (Cyan Line, Small Circular Markers)**
* **Spatial Grounding:** The label is located on the right side, positioned above the line segment connecting Models 9 and 10.
* **Visual Trend:** Spans Models 4 through 10. It starts in the mid-30s, dips at Model 5, rises steadily through Model 7, peaks at Model 8, drops sharply at Model 9, and flattens out with a slight rise at Model 10.
* **Data Points:**
* Model 4: ~34%
* Model 5: ~23%
* Model 6: ~34%
* Model 7: ~60%
* Model 8: ~67%
* Model 9: ~43%
* Model 10: ~45%
**3. LiveCodeBench (Green Line, Square Markers)**
* **Spatial Grounding:** The label is located on the right side, just above the data point for Model 9.
* **Visual Trend:** Spans Models 3 through 10. It remains remarkably flat and stable from Model 3 to Model 6. It then spikes sharply upward at Model 7, peaks at Model 8, drops precipitously at Model 9, and remains flat to Model 10.
* **Data Points:**
* Model 3: ~30%
* Model 4: ~30%
* Model 5: ~29%
* Model 6: ~29%
* Model 7: ~59%
* Model 8: ~74%
* Model 9: ~34%
* Model 10: ~34%
**4. SWE-bench Verified S (Brown Line, Upward Triangle Markers)**
* **Spatial Grounding:** The label is located on the lower right side, just below the data point for Model 9.
* **Visual Trend:** Spans Models 3 through 10. It exhibits a zig-zag pattern initially (rising at 4, dipping at 5), then climbs steadily through Model 7 to peak at Model 8. It drops sharply at Model 9 and declines slightly to Model 10.
* **Data Points:**
* Model 3: ~10%
* Model 4: ~22%
* Model 5: ~13%
* Model 6: ~21%
* Model 7: ~49%
* Model 8: ~59%
* Model 9: ~32%
* Model 10: ~28%
**5. Aider Polygot (Gray Line, Diamond Markers)**
* **Spatial Grounding:** The label is located at the bottom right, directly below the "SWE-bench Verified S" label.
* **Visual Trend:** Spans Models 3 through 10. It starts at the lowest point on the chart. It follows a similar zig-zag to the brown line (up at 4, down at 5, up at 6), then experiences a massive, steep climb through Model 7 to reach the highest peak among the lower four series at Model 8. It then crashes sharply at Model 9 and remains flat to Model 10.
* **Data Points:**
* Model 3: ~3%
* Model 4: ~17%
* Model 5: ~11%
* Model 6: ~21%
* Model 7: ~57%
* Model 8: ~82%
* Model 9: ~27%
* Model 10: ~27%
### Key Observations
* **The "Model 8" Anomaly:** There is a massive, uniform spike in performance at Model 8 across all four benchmarks that were tested on it. Aider Polygot sees the most dramatic increase, jumping from ~21% at Model 6 to ~82% at Model 8.
* **The "Model 5" Dip:** Conversely, Models 4, 5, and 6 show a consistent "V" shape across three of the benchmarks (SWE-bench M, SWE-bench S, and Aider Polygot), indicating Model 5 performed noticeably worse than the models immediately preceding and succeeding it.
* **Incomplete Data:** HumanEval is only plotted for Models 1-4, while the other four benchmarks are plotted for Models 3-10 (or 4-10).
* **Benchmark Correlation:** The four benchmarks spanning Models 3/4 to 10 exhibit highly correlated movement. They all dip at Model 5, rise at 6 and 7, peak at 8, and drop sharply at 9.
### Interpretation
The data strongly suggests a chronological or sequential progression of AI models (likely Large Language Models evaluated on coding tasks, given the benchmark names).
* **HumanEval as a Baseline:** HumanEval scores are significantly higher than the others for early models. This implies HumanEval is likely an older, easier, or more saturated benchmark. The testers may have stopped running it after Model 4 because it was no longer providing useful differentiation, shifting focus to the harder benchmarks.
* **Model 8 is a Breakthrough:** Model 8 represents a massive leap in capability. Given the sharp drop-off at Models 9 and 10, Model 8 might represent a much larger parameter model (e.g., a 70B model compared to 7B/8B models), a different architecture, or a model specifically fine-tuned for the tasks these benchmarks measure.
* **Models 9 & 10:** The fact that performance drops back down to levels similar to Models 4-6 suggests that Models 9 and 10 are not direct successors to Model 8 in terms of scale or capability. They might be smaller, more efficient models released later, or experimental branches that did not retain the coding capabilities of Model 8.
* **Benchmark Difficulty:** Based on the vertical stacking of the lines at the Model 8 peak, we can infer the relative difficulty of the benchmarks for that specific model: Aider Polygot (easiest/highest score) > LiveCodeBench > SWE-bench Verified M > SWE-bench Verified S (hardest/lowest score). However, this difficulty hierarchy is not strictly consistent across all models (e.g., at Model 4, SWE-bench M is higher than LiveCodeBench).
DECODING INTELLIGENCE...