\n
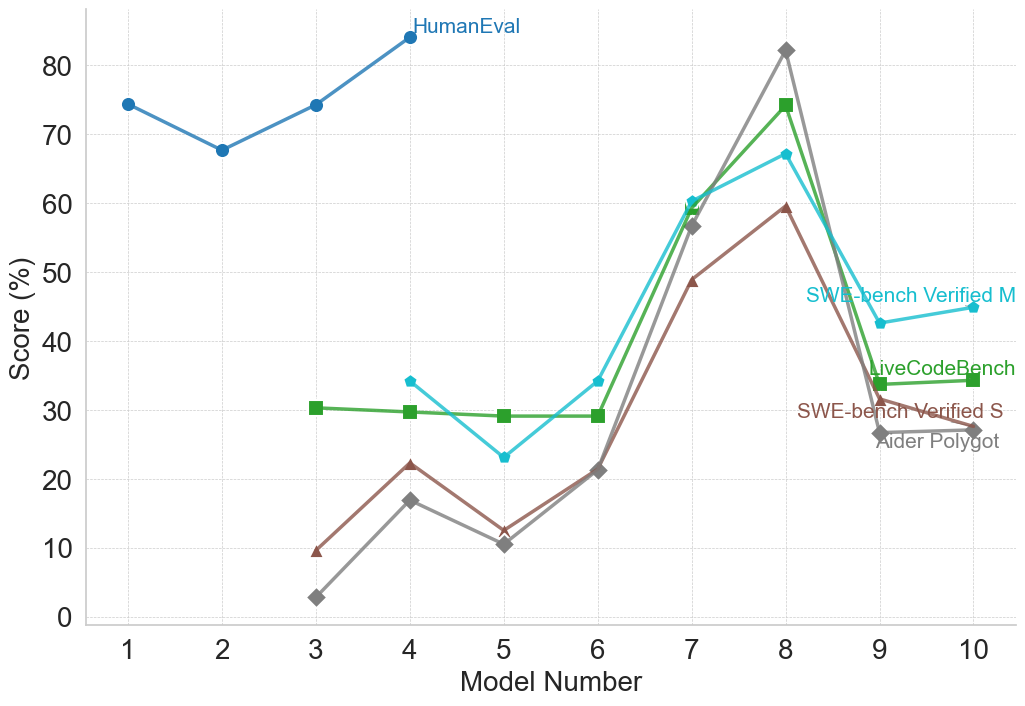
## Line Chart: Model Performance Comparison
### Overview
This line chart compares the performance of several models across a range of model numbers (1 to 10). The performance is measured as a "Score (%)" and is represented by different colored lines for each model. The chart appears to evaluate models on different benchmarks, as indicated by the legend.
### Components/Axes
* **X-axis:** "Model Number" ranging from 1 to 10.
* **Y-axis:** "Score (%)" ranging from 0 to 80.
* **Legend:** Located in the top-right corner, identifying the following data series:
* HumanEval (Blue)
* SWE-bench Verified M (Dark Green)
* LiveCodeBench (Orange)
* SWE-bench Verified S (Light Green)
* Aider Polylot (Grey)
### Detailed Analysis
Let's analyze each line individually, noting trends and approximate data points.
* **HumanEval (Blue):** This line starts at approximately 72% at Model Number 1, dips to around 65% at Model Number 2, then generally increases to approximately 82% at Model Number 8, and remains relatively stable around 80% for Models 9 and 10. The trend is generally upward.
* **SWE-bench Verified M (Dark Green):** This line is relatively flat, starting at approximately 28% at Model Number 1 and remaining around 30% until Model Number 6. It then increases to around 42% at Model Number 8, and then decreases to around 38% at Model Number 10.
* **LiveCodeBench (Orange):** This line starts at approximately 58% at Model Number 1, decreases to around 45% at Model Number 3, then increases sharply to approximately 70% at Model Number 8, and then decreases to around 65% at Model Number 10.
* **SWE-bench Verified S (Light Green):** This line starts at approximately 32% at Model Number 1, remains relatively flat around 30% until Model Number 6, then increases to around 40% at Model Number 8, and then decreases to around 35% at Model Number 10.
* **Aider Polylot (Grey):** This line starts at approximately 5% at Model Number 1, increases to around 18% at Model Number 4, then decreases to around 10% at Model Number 6, and then increases sharply to approximately 40% at Model Number 8, and then decreases to around 35% at Model Number 10.
### Key Observations
* **HumanEval consistently scores the highest**, significantly outperforming the other models, especially at higher model numbers.
* **Aider Polylot starts with the lowest scores** but shows the most significant relative improvement across model numbers.
* **SWE-bench Verified M and SWE-bench Verified S** exhibit similar trends, remaining relatively stable for the first six models and then showing an increase.
* **LiveCodeBench shows a significant increase in score** between Model Numbers 6 and 8.
* There is a general trend of increasing scores for most models as the model number increases, suggesting that model improvements lead to better performance.
### Interpretation
The data suggests that the models generally improve in performance as the model number increases, indicating that iterative development or training leads to better results. HumanEval appears to be the most robust benchmark, consistently showing high scores across all model numbers. Aider Polylot, while starting with low scores, demonstrates a substantial capacity for improvement. The differences in performance across the benchmarks (SWE-bench, LiveCodeBench, HumanEval) suggest that the models are evaluated on different types of coding tasks or with different evaluation criteria. The convergence of scores around Model Number 8-10 suggests that the models may be approaching a performance plateau on these benchmarks. The sharp increase in LiveCodeBench and Aider Polylot around Model Number 8 could indicate a specific optimization or architectural change implemented at that point.