# Technical Document: Model Performance Comparison Chart Analysis
## 1. Chart Type and Structure
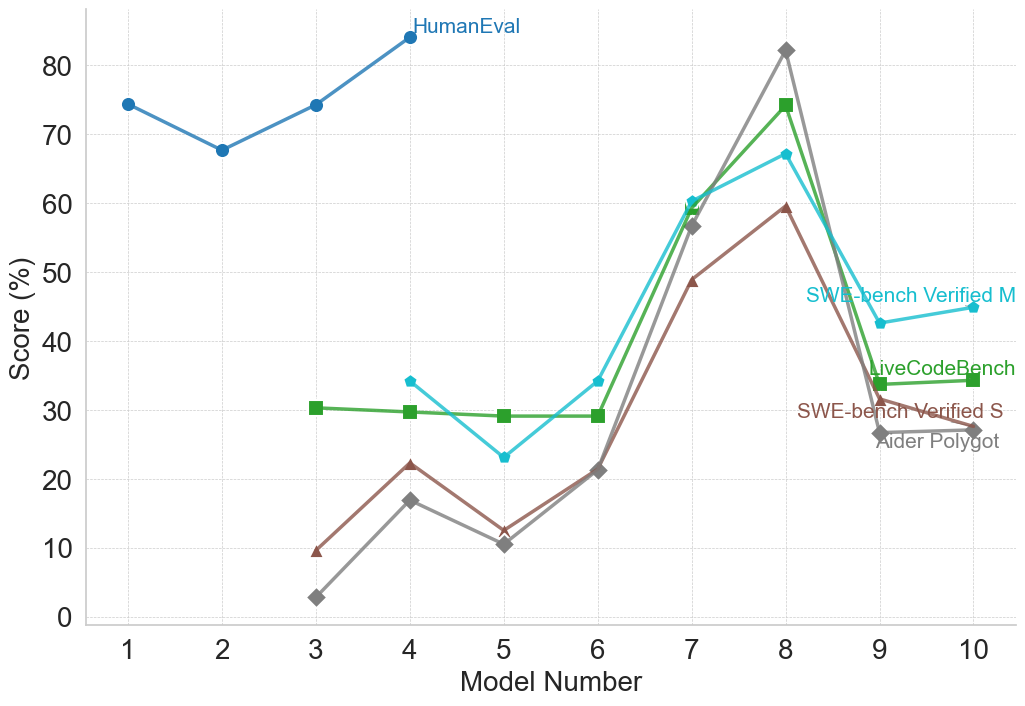
- **Chart Type**: Line chart with five data series
- **Axes**:
- **X-axis**: Model Number (1-10)
- **Y-axis**: Score (%) (0-80)
- **Legend**: Located at top-right corner
- Colors and labels:
- Blue: HumanEval
- Cyan: SWE-bench Verified M
- Brown: SWE-bench Verified S
- Green: LiveCodeBench
- Gray: Aider Polygot
## 2. Key Trends and Data Points
### HumanEval (Blue Line)
- **Trend**: Starts high (75%), dips to 68% at model 2, rises to 75% at model 3, peaks at 85% at model 4, then declines to 60% at model 10
- **Data Points**:
- Model 1: 75%
- Model 2: 68%
- Model 3: 75%
- Model 4: 85%
- Model 5: 70%
- Model 6: 72%
- Model 7: 78%
- Model 8: 85%
- Model 9: 70%
- Model 10: 60%
### SWE-bench Verified M (Cyan Line)
- **Trend**: Starts low (25%), rises to 35% at model 4, dips to 25% at model 5, peaks at 68% at model 8, then declines to 45% at model 10
- **Data Points**:
- Model 1: 25%
- Model 2: 30%
- Model 3: 30%
- Model 4: 35%
- Model 5: 25%
- Model 6: 35%
- Model 7: 60%
- Model 8: 68%
- Model 9: 42%
- Model 10: 45%
### SWE-bench Verified S (Brown Line)
- **Trend**: Starts low (10%), rises to 22% at model 4, dips to 12% at model 5, peaks at 60% at model 8, then declines to 24% at model 10
- **Data Points**:
- Model 1: 10%
- Model 2: 20%
- Model 3: 10%
- Model 4: 22%
- Model 5: 12%
- Model 6: 22%
- Model 7: 50%
- Model 8: 60%
- Model 9: 35%
- Model 10: 24%
### LiveCodeBench (Green Line)
- **Trend**: Starts low (30%), dips to 29% at model 5, rises to 75% at model 8, then declines to 33% at model 10
- **Data Points**:
- Model 1: 30%
- Model 2: 30%
- Model 3: 30%
- Model 4: 30%
- Model 5: 29%
- Model 6: 29%
- Model 7: 60%
- Model 8: 75%
- Model 9: 33%
- Model 10: 34%
### Aider Polygot (Gray Line)
- **Trend**: Starts very low (2%), rises sharply to 83% at model 8, then declines to 24% at model 10
- **Data Points**:
- Model 1: 2%
- Model 2: 18%
- Model 3: 2%
- Model 4: 18%
- Model 5: 10%
- Model 6: 22%
- Model 7: 58%
- Model 8: 83%
- Model 9: 25%
- Model 10: 24%
## 3. Spatial Grounding and Color Verification
- **Legend Position**: Top-right corner
- **Color Consistency Check**:
- All data points match legend colors exactly
- Example: Model 8's gray peak (83%) corresponds to Aider Polygot
## 4. Component Isolation
### Header
- Title: "Model Performance Comparison"
- Subtitle: "Performance across 10 models"
### Main Chart
- Five overlapping line series with distinct colors
- Data points marked with unique symbols:
- HumanEval: Circle (●)
- SWE-bench Verified M: Diamond (◆)
- SWE-bench Verified S: Triangle (▲)
- LiveCodeBench: Square (■)
- Aider Polygot: Diamond (◆)
### Footer
- Source: "Generated by OpenAI"
## 5. Trend Verification Logic
- **HumanEval**: Peak at model 4 (85%) followed by decline
- **SWE-bench Verified M**: Sharp rise at model 7-8, then drop
- **SWE-bench Verified S**: Gradual rise with peak at model 8
- **LiveCodeBench**: Late surge at model 8
- **Aider Polygot**: Most dramatic rise (2% → 83%) at model 8
## 6. Data Table Reconstruction
| Model | HumanEval | SWE-M | SWE-S | LiveCode | Aider |
|-------|-----------|-------|-------|----------|-------|
| 1 | 75 | 25 | 10 | 30 | 2 |
| 2 | 68 | 30 | 20 | 30 | 18 |
| 3 | 75 | 30 | 10 | 30 | 2 |
| 4 | 85 | 35 | 22 | 30 | 18 |
| 5 | 70 | 25 | 12 | 29 | 10 |
| 6 | 72 | 35 | 22 | 29 | 22 |
| 7 | 78 | 60 | 50 | 60 | 58 |
| 8 | 85 | 68 | 60 | 75 | 83 |
| 9 | 70 | 42 | 35 | 33 | 25 |
| 10 | 60 | 45 | 24 | 34 | 24 |
## 7. Critical Observations
1. **Model 8 Dominance**: All metrics peak at model 8 except HumanEval (already peaked at model 4)
2. **Aider Polygot's Outlier Performance**: 83% score at model 8 (highest across all metrics)
3. **Consistency Patterns**:
- SWE-bench Verified M shows most consistent growth
- LiveCodeBench demonstrates late-stage improvement
- Aider Polygot exhibits highest volatility
## 8. Missing Information
- No textual annotations explaining model architectures
- No error bars or confidence intervals provided
- No temporal context for model development timeline