## Network Diagram: Hierarchical Network Visualization
### Overview
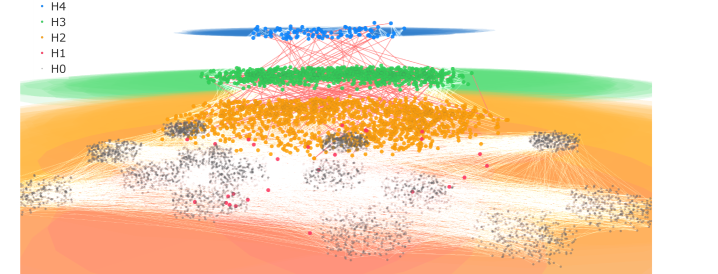
The image presents a hierarchical network diagram, visually representing relationships between different layers or levels. The diagram consists of several layers of nodes, each layer distinguished by color and labeled as H0, H1, H2, H3, and H4. Connections between nodes across different layers are indicated by lines. The background is colored to emphasize the hierarchical structure.
### Components/Axes
* **Layers:** The diagram has five distinct layers, each represented by a different color.
* H4: Blue
* H3: Green
* H2: Orange
* H1: Pink/Red
* H0: Gray
* **Nodes:** Each layer contains multiple nodes, represented by small circles.
* **Connections:** Lines connect nodes between different layers, indicating relationships or interactions.
* **Background:** The background is colored with horizontal bands of color corresponding to the layers, providing visual separation.
### Detailed Analysis
* **H4 (Blue):** Located at the top of the diagram. The nodes are densely clustered together. Connections extend downwards to the H3 layer.
* **H3 (Green):** Situated below the H4 layer. The nodes are also densely clustered. Connections extend downwards to the H2 layer.
* **H2 (Orange):** Located below the H3 layer. The nodes are more dispersed compared to H3. Connections extend downwards to the H1 layer.
* **H1 (Pink/Red):** Located below the H2 layer. The nodes are more dispersed and less numerous. Connections extend downwards to the H0 layer.
* **H0 (Gray):** Located at the bottom of the diagram. The nodes are grouped into several distinct clusters.
The connections between layers appear to be directed downwards, suggesting a flow or dependency from higher layers to lower layers. The density of nodes decreases from top to bottom, with H4 and H3 having the highest density and H0 having the lowest.
### Key Observations
* The diagram illustrates a hierarchical structure with distinct layers.
* The density of nodes varies across layers, with higher layers having more nodes.
* Connections between layers suggest a flow or dependency from higher to lower layers.
* The H0 layer exhibits clustering, indicating potential subgroups or modules within that layer.
### Interpretation
The network diagram likely represents a system or process with multiple levels of organization. The layers (H4 to H0) could represent different stages, components, or levels of abstraction. The connections between nodes indicate interactions or dependencies between these elements. The decreasing density of nodes from top to bottom might suggest a funneling effect, where information or resources are consolidated as they flow through the system. The clustering in the H0 layer could indicate the presence of distinct functional units or modules at the lowest level of the hierarchy.