\n
## Diagram: Network Visualization with Hierarchical Layers
### Overview
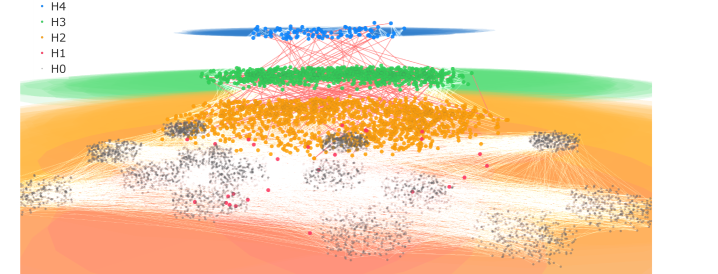
The image presents a network visualization diagram, likely representing connections or relationships between numerous nodes. The diagram is structured into hierarchical layers, denoted as H0 through H4, with nodes clustered and connected by lines. The visualization appears to show a flow or transition of data/connections from a dense lower layer (H0) upwards through intermediate layers (H1, H2, H3) to a sparser upper layer (H4). The diagram uses color to differentiate nodes within each layer.
### Components/Axes
The diagram is organized into five horizontal layers labeled H0 (bottom), H1, H2, H3, and H4 (top). There are no explicit axes in the traditional sense, but the vertical position represents a hierarchical level. The diagram uses color to distinguish nodes:
* **H0:** Orange/Brown
* **H1:** Yellow/Orange
* **H2:** Green
* **H3:** Pink/Red
* **H4:** Blue
The diagram consists of numerous small nodes (dots) connected by thin lines, representing relationships or flows between them. The density of nodes and connections varies significantly across layers.
### Detailed Analysis or Content Details
The diagram shows a significant concentration of nodes in the H0 and H1 layers. The H0 layer (orange/brown) is the most densely populated, with a large number of nodes clustered together. Connections extend upwards from H0 to H1, creating a complex web of lines.
The H1 layer (yellow/orange) is also densely populated, but less so than H0. Connections continue upwards from H1 to H2.
The H2 layer (green) has a moderate density of nodes, forming a more distinct cluster. Connections extend upwards from H2 to H3.
The H3 layer (pink/red) has a lower density of nodes, appearing more scattered. Connections extend upwards from H3 to H4.
The H4 layer (blue) is the least densely populated, with a small number of nodes. The lines connecting to H4 appear to originate from multiple nodes in H3.
The lines connecting the nodes are very thin and numerous, making it difficult to discern individual connections. The lines appear to be directed, suggesting a flow from lower layers to higher layers. There are also some connections *within* each layer, indicating relationships between nodes at the same hierarchical level.
There are a few darker, more prominent nodes within the H0 and H1 layers, suggesting they may represent more significant entities or hubs.
### Key Observations
* **Hierarchical Structure:** The diagram clearly demonstrates a hierarchical structure with five distinct layers.
* **Density Gradient:** Node density decreases as you move up the hierarchy, from H0 to H4.
* **Flow Direction:** The connections suggest a flow of information or relationships from lower layers to higher layers.
* **Hub Nodes:** The presence of darker nodes in H0 and H1 suggests the existence of central entities or hubs.
* **Complexity:** The diagram is highly complex, with a large number of nodes and connections, making it difficult to analyze individual relationships.
### Interpretation
This diagram likely represents a network or system with a hierarchical organization. The layers could represent different levels of abstraction, stages in a process, or categories of entities. The flow of connections from lower to higher layers suggests a process of aggregation, filtering, or transformation.
The decreasing density of nodes as you move up the hierarchy could indicate that information is being consolidated or that less detail is retained at higher levels. The hub nodes in the lower layers may represent key entities that play a central role in the system.
The diagram could be used to visualize a variety of systems, such as:
* **Social Networks:** Layers could represent different levels of social connection (e.g., friends, family, acquaintances).
* **Information Processing:** Layers could represent stages in a data processing pipeline (e.g., raw data, pre-processing, analysis, visualization).
* **Organizational Structure:** Layers could represent different levels of management within a company.
* **Biological Networks:** Layers could represent different levels of biological organization (e.g., genes, proteins, cells, tissues).
Without additional context, it is difficult to determine the specific meaning of the diagram. However, the hierarchical structure and flow of connections suggest a system where information or relationships are processed and transformed as they move through different levels of abstraction. The diagram is a visualization of relationships, and the specific meaning is dependent on the domain it represents.