## Network Diagram: Hierarchical Layered Graph
### Overview
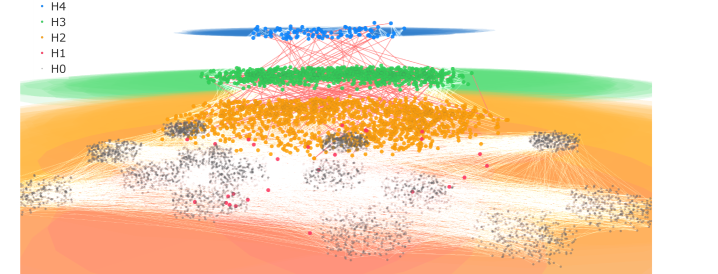
The image displays a complex, multi-layered network graph visualization. It depicts a hierarchical structure with nodes organized into distinct horizontal layers, connected by a dense web of edges. The visualization uses color-coding to differentiate node categories, as defined by a legend. The overall impression is of a complex system with strong inter-layer connections and clustered sub-structures within the lower layers.
### Components/Axes
* **Legend (Top-Left Corner):** A vertical list defining five node categories by color and label.
* **H4:** Blue
* **H3:** Green
* **H2:** Orange
* **H1:** Gray
* **H0:** Red
* **Main Graph Area:** The visualization is structured into approximate horizontal strata, from top to bottom:
1. **Top Layer (H4):** A dense, compact cluster of blue nodes.
2. **Second Layer (H3):** A wide, dense band of green nodes directly below the blue layer.
3. **Third Layer (H2):** A broad, dense field of orange nodes below the green layer.
4. **Bottom Layer (H1/H0):** A complex region containing clusters of gray nodes (H1) interspersed with sparse red nodes (H0). This layer spans the entire width and appears to have the most internal structure.
* **Connections (Edges):** A vast number of fine, semi-transparent lines connect nodes. The highest density of connections appears to run vertically between adjacent layers (e.g., H4 to H3, H3 to H2). There are also significant connections within layers, particularly within the bottom gray/red layer, forming distinct clusters.
### Detailed Analysis
* **Node Distribution & Density:**
* **H4 (Blue):** Forms a single, tight, elliptical cluster at the top-center of the diagram. It appears to be the smallest group by node count.
* **H3 (Green):** Forms a wide, dense horizontal band directly beneath H4. It is significantly larger in spatial extent and node count than H4.
* **H2 (Orange):** Forms the largest and densest horizontal band, occupying the central portion of the diagram. It contains the highest apparent number of nodes.
* **H1 (Gray):** Nodes are not uniformly distributed but are aggregated into multiple distinct, dense clusters scattered across the bottom region. There appear to be approximately 6-8 major clusters.
* **H0 (Red):** These nodes are sparse and appear as individual points or very small groups embedded within or near the gray (H1) clusters. They are the least numerous category.
* **Connection Patterns:**
* The network exhibits a clear **feed-forward or hierarchical flow** from the top layers (H4, H3) down to the bottom layers (H2, H1/H0). The connection density is highest between immediate neighbors in this hierarchy.
* The bottom layer (H1/H0) shows significant **intra-layer connectivity**, with dense webs of connections within and between the gray clusters, suggesting complex local interactions or sub-networks.
* The connections from the orange (H2) layer to the bottom layer appear to converge onto the specific gray clusters, indicating a many-to-few or targeted mapping.
### Key Observations
1. **Clear Hierarchical Stratification:** The primary organizing principle is a top-down hierarchy (H4 -> H3 -> H2 -> H1/H0).
2. **Inversion of Size/Complexity:** The top of the hierarchy (H4) is the simplest and smallest, while the base (H1/H0) is the most complex, numerous, and internally structured. This is an inverted pyramid structure.
3. **Clustered Base Layer:** The bottom layer is not homogeneous but is composed of discrete, densely connected modules (the gray clusters).
4. **Sparse "Outlier" Nodes:** The red (H0) nodes are rare and embedded within the gray clusters, suggesting they may represent special states, errors, or a distinct sub-category within the base layer.
5. **Visual Weight:** The orange (H2) layer dominates the visual field due to its density and central placement, acting as a major hub or processing layer between the upper and lower tiers.
### Interpretation
This diagram likely visualizes a **hierarchical system with increasing complexity and specialization at lower levels**. Potential interpretations include:
* **Neural Network Architecture:** It could represent a deep learning model where H4 is the input layer, H3 and H2 are hidden layers, and the clustered H1/H0 represents a complex output or embedding space. The red nodes (H0) might be specific output classes or anomaly detections.
* **Organizational or Social Network:** H4 could be top leadership, H3 middle management, H2 operational teams, and the H1 clusters represent specialized departments or project teams, with H0 being key individuals or external liaisons.
* **Information or Data Flow:** It may depict data processing stages: H4 (raw data ingestion), H3 (initial processing), H2 (core analysis/aggregation), and H1/H0 (specialized storage, application, or user-facing outputs in clustered databases or services).
The **key insight** is the structural relationship: a broad, dense intermediary layer (H2) funnels information or control from a small, unified top (H4/H3) into a fragmented, modular, and highly interactive base (H1/H0). The sparse red nodes (H0) are critical anomalies or special elements within the foundational modules. The visualization emphasizes **connectivity and hierarchy over individual node identity**, showcasing the system's architecture rather than its specific components.