TECHNICAL ASSET FINGERPRINT
d08508db0de15c4272bb1b93
Click to view fullscreen
Press ESC or click to close
FOUND IN PAPERS
EXPERT: healer-alpha-free VERSION 1
RUNTIME: free/openrouter/healer-alpha
INTEL_VERIFIED
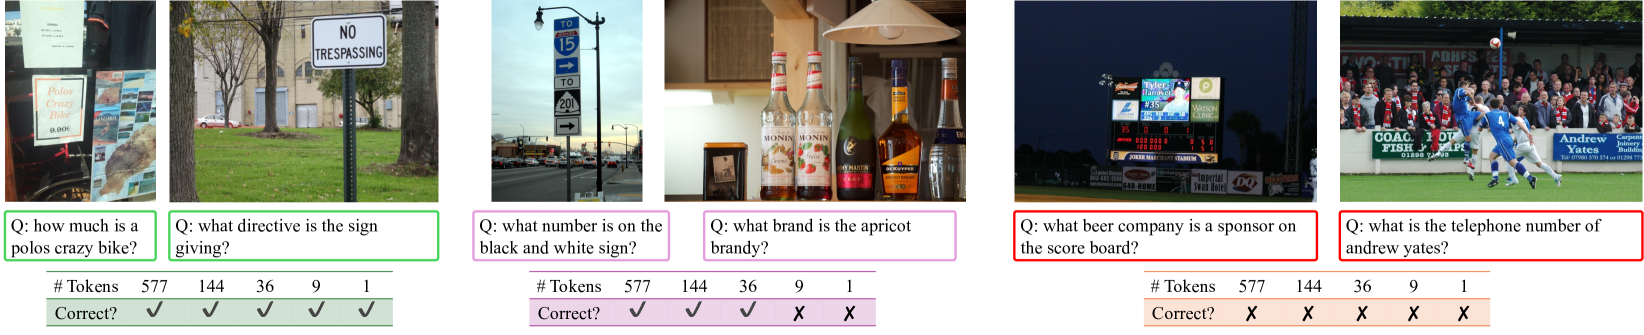
## Visual Question Answering (VQA) Performance Comparison
### Overview
The image is a composite figure displaying six distinct visual question-answering (VQA) scenarios. Each scenario is presented in a separate panel, arranged horizontally. Each panel contains: 1) a photograph, 2) a specific question about the photograph, and 3) a small table showing the performance of five different models or methods, measured by token count and correctness. The panels are grouped by colored borders (green, purple, red), likely indicating different performance tiers or categories.
### Components/Axes
The image is segmented into six vertical panels. Each panel has the following consistent structure:
1. **Photograph**: A real-world image containing visual information relevant to the question.
2. **Question Box**: A colored box (green, purple, or red) containing a question prefixed with "Q:".
3. **Performance Table**: A small table with two rows:
* **# Tokens**: Lists five numerical values (577, 144, 36, 9, 1), presumably representing the token count or model size for five different systems.
* **Correct?**: Shows a checkmark (✓) or cross (✗) for each token count, indicating whether the answer generated by that system was correct.
**Spatial Grounding**: The legend (the performance table) is consistently placed at the bottom of each panel. The question is positioned directly below the photograph. The colored borders group the panels: the first two are green, the next two are purple, and the final two are red.
### Detailed Analysis
**Panel 1 (Green Border - Leftmost)**
* **Photograph**: A close-up of a storefront or kiosk. A prominent sign reads "Polos Crazy Bike" with a price of "$20.00" below it. Other text and images are partially visible but less clear.
* **Question**: "Q: how much is a polos crazy bike?"
* **Performance Table**:
* # Tokens: 577, 144, 36, 9, 1
* Correct?: ✓, ✓, ✓, ✓, ✓
* **Trend**: All five models, regardless of token count, answered correctly.
**Panel 2 (Green Border)**
* **Photograph**: A "NO TRESPASSING" sign on a metal post in a grassy area with trees and a building in the background.
* **Question**: "Q: what directive is the sign giving?"
* **Performance Table**:
* # Tokens: 577, 144, 36, 9, 1
* Correct?: ✓, ✓, ✓, ✓, ✓
* **Trend**: All five models answered correctly.
**Panel 3 (Purple Border)**
* **Photograph**: A street scene with a black and white directional sign on a lamppost. The sign has arrows and numbers. The top section shows "TO 15" with an arrow pointing up. The bottom section shows "TO 201" with an arrow pointing right.
* **Question**: "Q: what number is on the black and white sign?"
* **Performance Table**:
* # Tokens: 577, 144, 36, 9, 1
* Correct?: ✓, ✓, ✓, ✗, ✗
* **Trend**: The three larger models (577, 144, 36 tokens) answered correctly. The two smallest models (9 and 1 token) failed.
**Panel 4 (Purple Border)**
* **Photograph**: A collection of bottles on a shelf. One bottle in the center has a label that reads "MONIN" and "Abricot" (French for Apricot). Other bottles include "Stolichnaya" vodka and "Grand Marnier".
* **Question**: "Q: what brand is the apricot brandy?"
* **Performance Table**:
* # Tokens: 577, 144, 36, 9, 1
* Correct?: ✓, ✓, ✓, ✗, ✗
* **Trend**: Identical to Panel 3. The three larger models succeeded; the two smallest failed.
**Panel 5 (Red Border)**
* **Photograph**: A baseball scoreboard at night. The scoreboard displays team logos and names. A prominent sponsor logo for "Budweiser" (the beer company) is visible at the top.
* **Question**: "Q: what beer company is a sponsor on the score board?"
* **Performance Table**:
* # Tokens: 577, 144, 36, 9, 1
* Correct?: ✗, ✗, ✗, ✗, ✗
* **Trend**: All five models failed to answer correctly.
**Panel 6 (Red Border - Rightmost)**
* **Photograph**: A soccer match scene. In the background, an advertising board is visible with the text "Andrew Yates" and a telephone number "01283 740501".
* **Question**: "Q: what is the telephone number of andrew yates?"
* **Performance Table**:
* # Tokens: 577, 144, 36, 9, 1
* Correct?: ✗, ✗, ✗, ✗, ✗
* **Trend**: All five models failed to answer correctly.
### Key Observations
1. **Performance Gradient by Task Difficulty**: The colored borders correlate with overall success rate. Green panels (easy tasks) have 100% success across all models. Purple panels (medium difficulty) show a clear performance cliff: models with 36+ tokens succeed, while those with 9 or fewer fail. Red panels (hard tasks) result in complete failure for all models.
2. **Token Count vs. Capability**: There is a strong, but not absolute, correlation between token count (model size) and performance. Larger models (577, 144, 36 tokens) handle the medium-difficulty tasks, while all models struggle with the hard tasks.
3. **Nature of Failures**: The failures in the red panels are not due to model size but likely due to the inherent difficulty of the tasks. Panel 5 requires identifying a specific brand logo in a cluttered scene, and Panel 6 requires precise optical character recognition (OCR) of a small, non-central text element in a complex image.
4. **Task Types**: The questions test different capabilities: simple text reading (Panel 1), sign interpretation (Panel 2), selective number extraction from multiple options (Panel 3), brand identification from a label (Panel 4), logo recognition (Panel 5), and fine-grained OCR (Panel 6).
### Interpretation
This figure demonstrates a benchmark for evaluating multimodal AI models on visual question answering. The data suggests a clear hierarchy of task difficulty for current models.
* **Foundational Tasks (Green)**: Reading prominent, isolated text and understanding simple symbolic signs are solved problems, even for very small models (1 token).
* **Intermediate Tasks (Purple)**: Selecting the correct information from a visually cluttered scene with multiple similar elements (e.g., choosing between numbers 15 and 201 on a sign, or identifying the correct brand among several bottles) requires a moderate level of model capacity. There is a sharp performance drop below a certain model size threshold (somewhere between 36 and 9 tokens in this evaluation).
* **Advanced Tasks (Red)**: Recognizing specific commercial logos in context and performing high-precision OCR on small, incidental text in complex scenes remain significant challenges for all models tested, regardless of size. This indicates a gap in current capabilities for fine-grained visual understanding and text extraction in unconstrained environments.
The figure effectively argues that while scaling model size (tokens) improves performance on tasks of moderate complexity, it does not guarantee success on all visual understanding problems. Some tasks require specific architectural strengths or training data that even larger models in this set lack. The consistent failure on the red-panel tasks highlights a frontier for future model development.
DECODING INTELLIGENCE...