## Violin Plot: Reliance Sensibility Comparison
### Overview
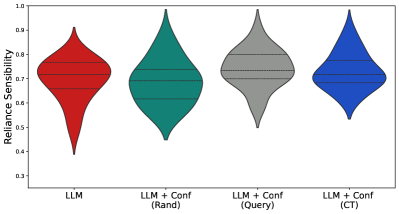
The image is a violin plot comparing the "Reliance Sensibility" of different configurations. The x-axis represents the configurations: LLM, LLM + Conf (Rand), LLM + Conf (Query), and LLM + Conf (CT). The y-axis represents "Reliance Sensibility" ranging from 0.3 to 1.0. Each violin plot shows the distribution of the "Reliance Sensibility" for each configuration.
### Components/Axes
* **Title:** There is no explicit title.
* **X-axis:**
* Label: Configurations
* Categories: LLM, LLM + Conf (Rand), LLM + Conf (Query), LLM + Conf (CT)
* **Y-axis:**
* Label: Reliance Sensibility
* Scale: 0.3 to 1.0, with increments of 0.1 (0.3, 0.4, 0.5, 0.6, 0.7, 0.8, 0.9, 1.0)
* **Violin Plot Colors:**
* LLM: Red
* LLM + Conf (Rand): Teal
* LLM + Conf (Query): Gray
* LLM + Conf (CT): Blue
* **Horizontal Lines:** Each violin plot contains 3 horizontal dashed lines, representing different statistical measures (likely quartiles or percentiles).
### Detailed Analysis
* **LLM (Red):** The violin plot is centered around 0.75, with a range from approximately 0.4 to 0.9.
* **LLM + Conf (Rand) (Teal):** The violin plot is centered around 0.75, with a range from approximately 0.5 to 0.95.
* **LLM + Conf (Query) (Gray):** The violin plot is centered around 0.75, with a range from approximately 0.5 to 0.9.
* **LLM + Conf (CT) (Blue):** The violin plot is centered around 0.75, with a range from approximately 0.5 to 0.95.
### Key Observations
* All configurations have a similar median "Reliance Sensibility" around 0.75.
* The "LLM + Conf (Rand)" and "LLM + Conf (CT)" configurations appear to have slightly wider distributions, indicating more variability in "Reliance Sensibility".
* The "LLM" configuration has the lowest minimum "Reliance Sensibility" value.
### Interpretation
The violin plot suggests that adding confidence measures (Conf) to the LLM generally maintains or slightly improves the "Reliance Sensibility". The "LLM + Conf (Rand)" and "LLM + Conf (CT)" configurations show a slightly wider range of "Reliance Sensibility" values, which could indicate that these configurations are more sensitive to the specific inputs or conditions. The "LLM" configuration alone has the potential for the lowest "Reliance Sensibility", suggesting that confidence measures can help to mitigate this.