## Violin Plot: Reliance Sensitivity Comparison Across Model Configurations
### Overview
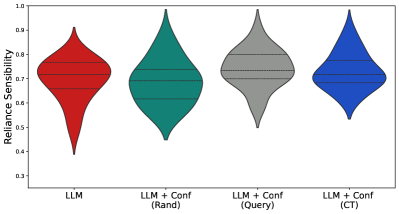
The image presents a comparative analysis of Reliance Sensitivity across four model configurations using violin plots. Each plot visualizes the distribution of sensitivity scores, with horizontal lines indicating median and quartile values. The configurations compared are:
1. **LLM** (baseline)
2. **LLM + Conf (Rand)**
3. **LLM + Conf (Query)**
4. **LLM + Conf (CT)**
### Components/Axes
- **X-axis**: Model configurations (LLM, LLM + Conf (Rand), LLM + Conf (Query), LLM + Conf (CT)), labeled in sequence from left to right.
- **Y-axis**: Reliance Sensitivity, scaled from 0.3 to 1.0 in increments of 0.1.
- **Legend**: Located at the bottom, mapping colors to configurations:
- Red: LLM
- Teal: LLM + Conf (Rand)
- Gray: LLM + Conf (Query)
- Blue: LLM + Conf (CT)
### Detailed Analysis
1. **LLM (Red)**:
- Median: ~0.7 (horizontal line).
- Interquartile range (IQR): ~0.65–0.75.
- Full range: ~0.4–0.8.
- Distribution: Symmetrical with a slight skew toward higher values.
2. **LLM + Conf (Rand) (Teal)**:
- Median: ~0.65.
- IQR: ~0.6–0.7.
- Full range: ~0.5–0.8.
- Distribution: Narrower spread compared to LLM, with a peak near the median.
3. **LLM + Conf (Query) (Gray)**:
- Median: ~0.7.
- IQR: ~0.65–0.75.
- Full range: ~0.55–0.85.
- Distribution: Broader than LLM + Conf (Rand), with a slight upward skew.
4. **LLM + Conf (CT) (Blue)**:
- Median: ~0.75.
- IQR: ~0.7–0.8.
- Full range: ~0.6–0.9.
- Distribution: Widest spread, with a pronounced peak near the median and a long tail toward higher values.
### Key Observations
- **Highest Median**: LLM + Conf (CT) achieves the highest median Reliance Sensitivity (~0.75), outperforming all other configurations.
- **Lowest Median**: LLM + Conf (Rand) has the lowest median (~0.65), indicating poorer performance compared to the baseline LLM.
- **Spread Variability**:
- LLM + Conf (CT) exhibits the widest distribution, suggesting greater variability in sensitivity scores.
- LLM + Conf (Rand) has the narrowest spread, indicating more consistent (but lower) performance.
- **Baseline Comparison**: The baseline LLM (red) performs better than LLM + Conf (Rand) but worse than LLM + Conf (Query) and CT.
### Interpretation
The data suggests that augmenting the LLM with configuration-specific enhancements (Conf) generally improves Reliance Sensitivity, with the **CT (Contextual Tuning)** configuration yielding the most significant gains. The **Query** configuration matches the baseline LLM in median performance but shows slightly better upper-bound performance.
The **LLM + Conf (Rand)** configuration underperforms the baseline, raising questions about the efficacy of random configuration additions. The **CT** configuration’s wider spread implies that while it achieves higher sensitivity on average, its performance is more variable across different use cases or datasets.
This analysis highlights the importance of targeted configuration tuning (e.g., CT) over generic or random enhancements for optimizing Reliance Sensitivity in LLM-based systems.