## Diagram: Knowledge Graph Task Resolution
### Overview
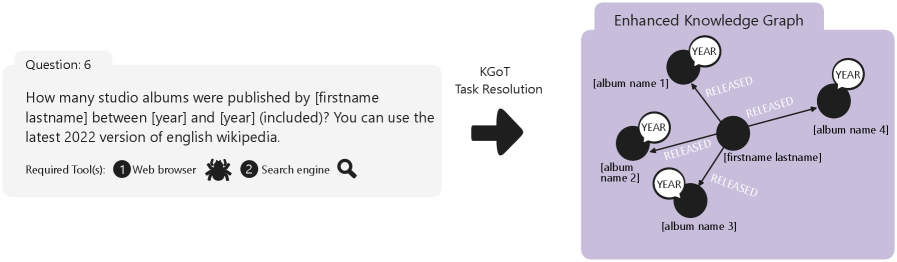
The image presents a diagram illustrating the resolution of a question using an enhanced knowledge graph. The question involves finding the number of studio albums published by a specific artist within a given time frame. The diagram shows the process of using web browser and search engine tools to query a knowledge graph and retrieve the necessary information.
### Components/Axes
* **Left Side:**
* **Question:** "Question: 6"
* **Question Text:** "How many studio albums were published by [firstname lastname] between [year] and [year] (included)? You can use the latest 2022 version of english wikipedia."
* **Required Tools:**
* "1 Web browser" (with a web browser icon)
* "2 Search engine" (with a magnifying glass icon)
* **Middle:**
* **KGOT Task Resolution:** Text label.
* **Arrow:** A thick black arrow pointing from left to right, indicating the flow of task resolution.
* **Right Side:**
* **Enhanced Knowledge Graph:** Title of the knowledge graph diagram, enclosed in a rounded rectangle with a light purple background.
* **Nodes:**
* A central node labeled "[firstname lastname]".
* Four nodes labeled "[album name 1]", "[album name 2]", "[album name 3]", and "[album name 4]".
* Each album node has a smaller node attached to it labeled "YEAR".
* **Edges:**
* Edges labeled "RELEASED" connect the central node to each of the album nodes.
### Detailed Analysis or Content Details
* **Question:** The question requires finding the number of studio albums published by a specific artist within a specified year range.
* **Tools:** The required tools are a web browser and a search engine, suggesting that the information needs to be retrieved from online sources.
* **Knowledge Graph:** The knowledge graph represents the relationships between the artist and their albums. The central node represents the artist, and the surrounding nodes represent the albums. The "RELEASED" edges indicate that the artist released these albums. The "YEAR" nodes associated with each album indicate the release year of the album.
### Key Observations
* The diagram illustrates a process of using external tools (web browser, search engine) to query a knowledge graph.
* The knowledge graph is structured to represent the relationship between an artist and their albums, including the release year of each album.
* The diagram suggests that the question can be answered by querying the knowledge graph for albums released by the specified artist within the specified year range.
### Interpretation
The diagram demonstrates how a question requiring external knowledge can be resolved using a knowledge graph. The question is first processed to identify the necessary information (artist, year range). Then, external tools are used to query a knowledge graph, which contains structured information about the artist and their albums. The knowledge graph is then used to retrieve the relevant information and answer the question. The diagram highlights the importance of knowledge graphs in question answering and information retrieval. The use of the 2022 version of English Wikipedia suggests that the knowledge graph is based on up-to-date information.